
Aging inland hopper barges, rising costs could strain U.S. grain exports


Key points
- The U.S. inland hopper barge fleet is aging rapidly. The average barge is approaching 17.6 years old, while the typical useful life is 25 to 30 years.
- Rising costs of steel, fiberglass, labor and construction financing have pushed the price of a new inland hopper barge up to roughly $1 million or more, according to industry estimates, thereby discouraging fleet replacement.
- Replacement is not keeping pace with retirements. The industry is building about 410 new inland hopper barges a year while retiring 500 to 1,000.
- Alternatives are sparse. Railroads can absorb only a small portion of barge traffic, leaving agriculture heavily dependent on inland waterways.
- Higher barge costs could weaken farm-level prices. Rising freight costs tend to pressure basis levels and reduce farmer returns and could threaten U.S. export competitiveness.
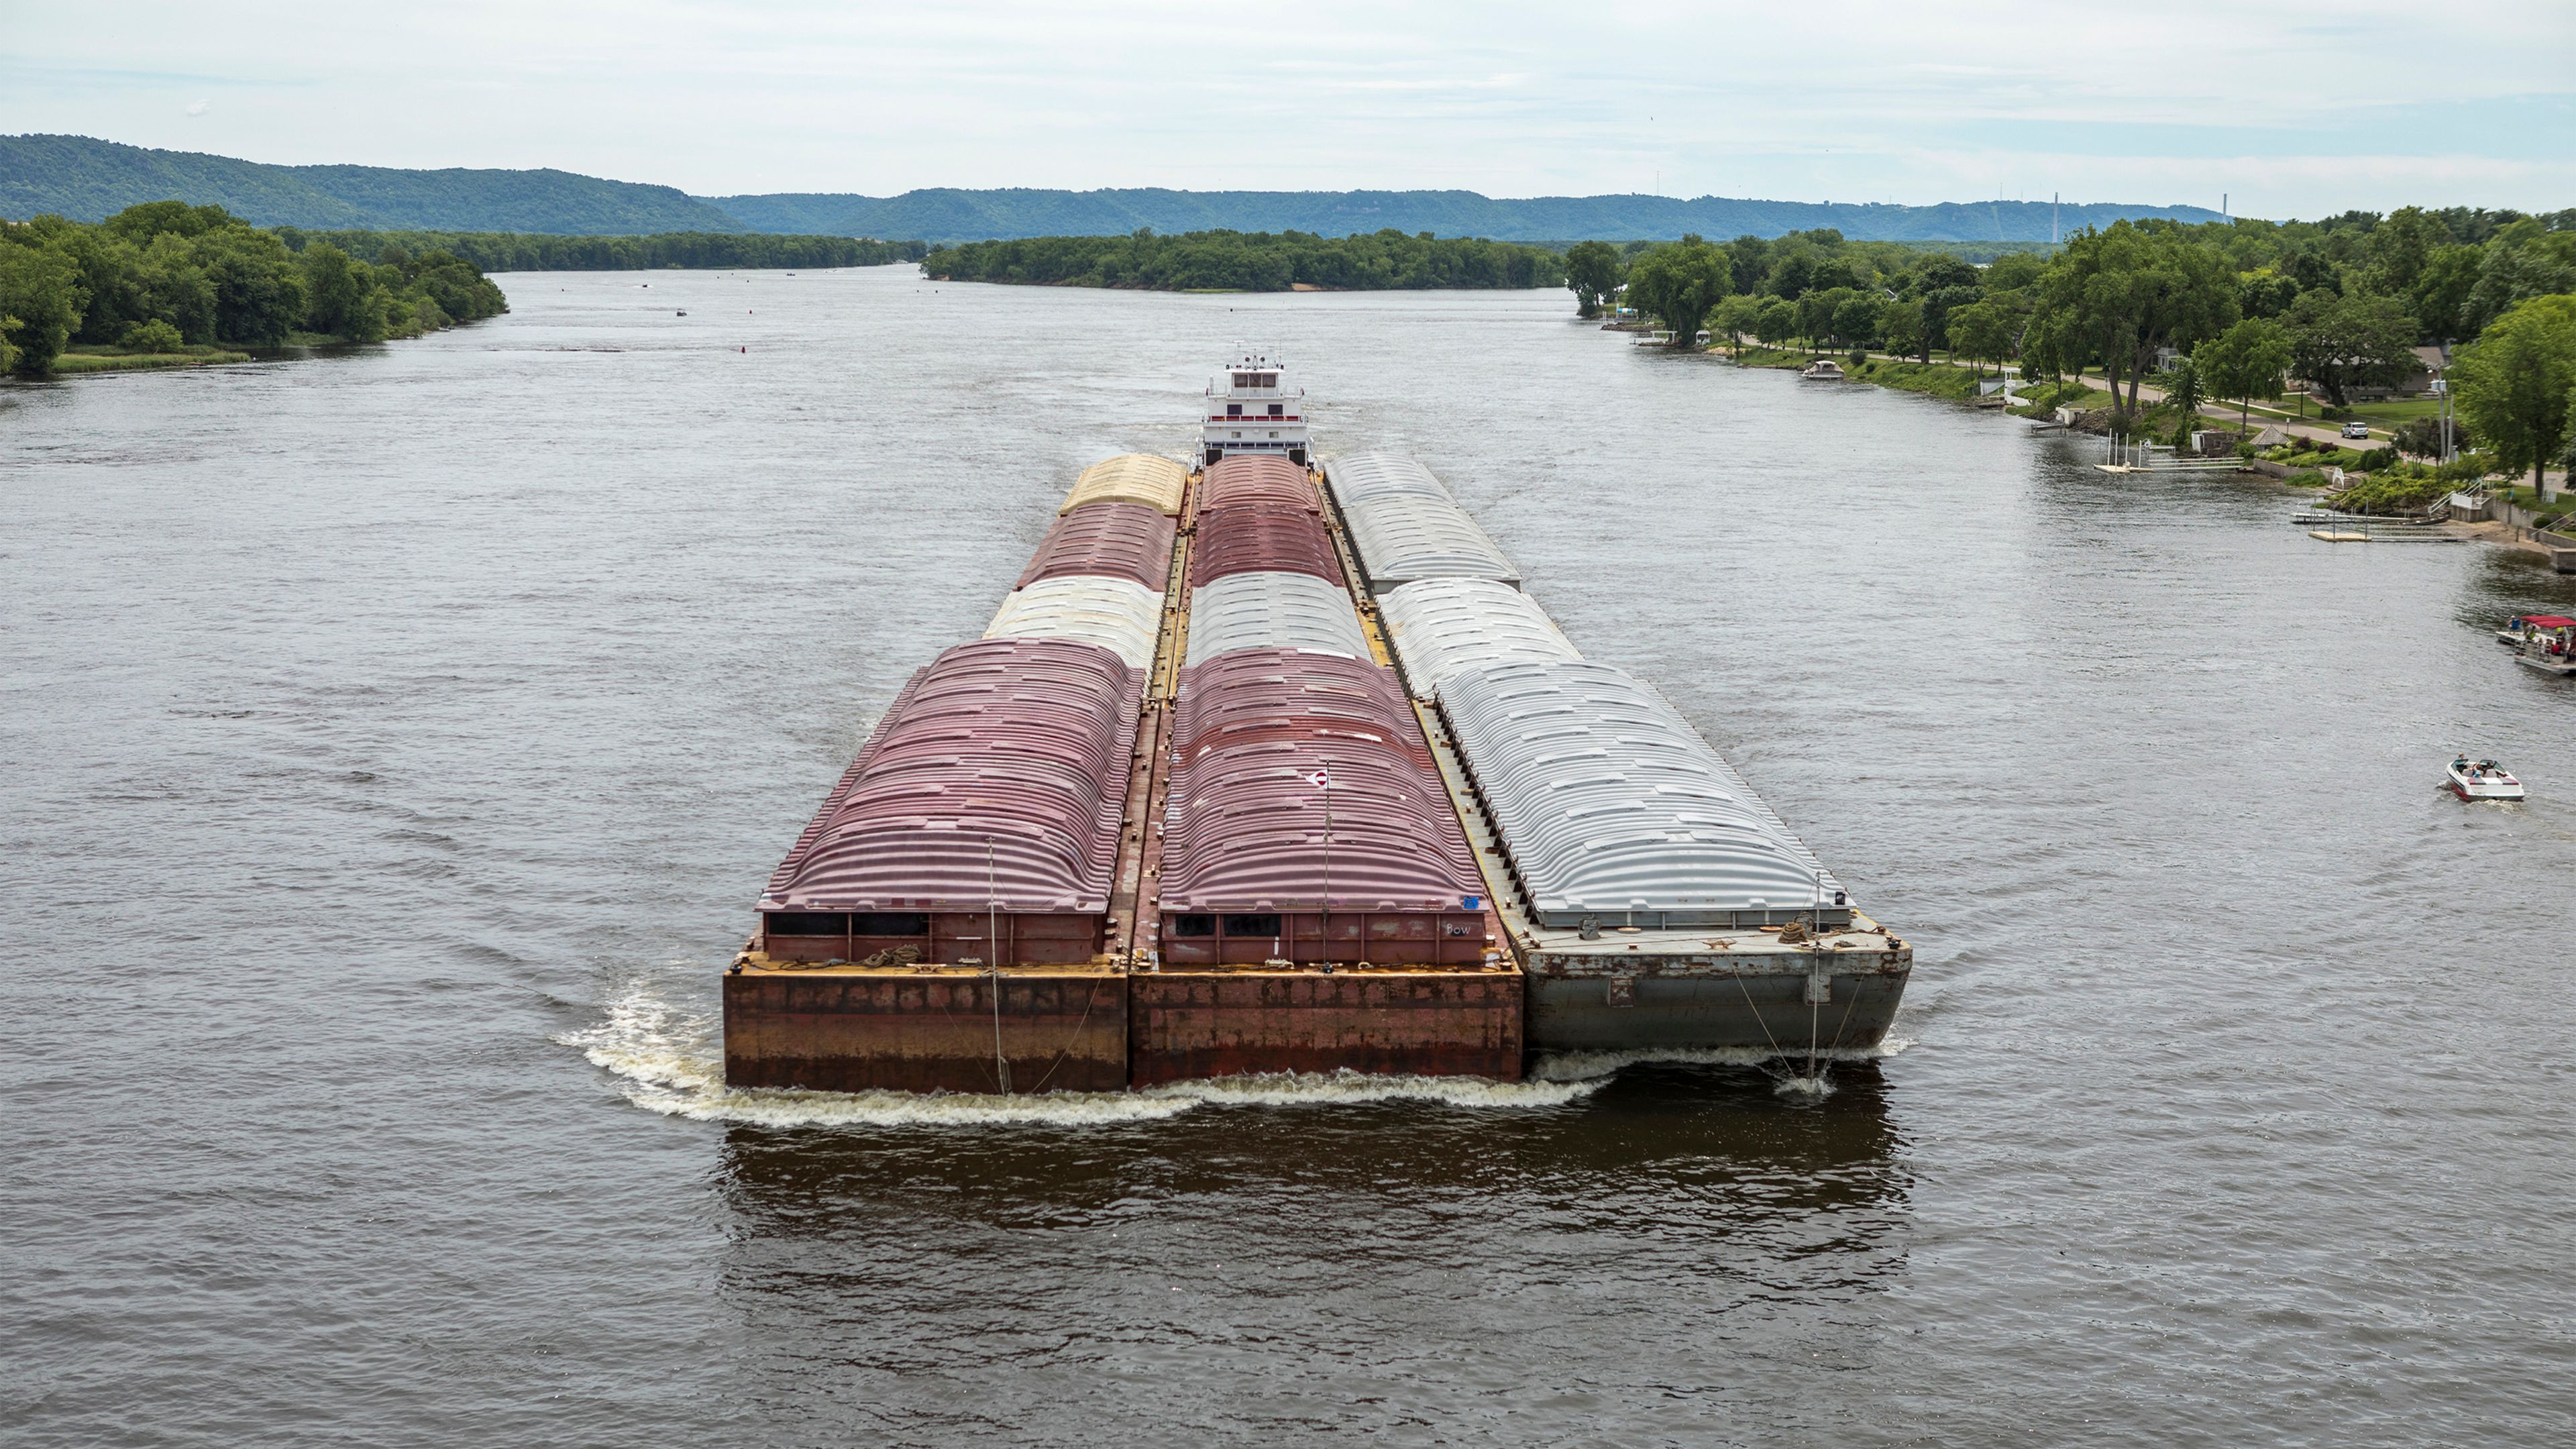
With a quietly aging and shrinking inland hopper barge fleet, U.S. grain exports face a looming transportation bottleneck, with the most urgent issues emerging on the Mississippi River, the backbone of the U.S. grain export system. According to USDA’s Agricultural Marketing Service, inland hopper barges transport roughly half of all U.S. corn and soybean exports and a third of wheat exports through the Mississippi Gulf region, making the inland waterways essential to maintaining U.S. competitiveness in global grain markets. Farmers and elevators in the Upper Midwest and river-adjacent grain-producing regions are likely most exposed because they rely heavily on barge access to reach Gulf export terminals.
An aging fleet faces a replacement gap
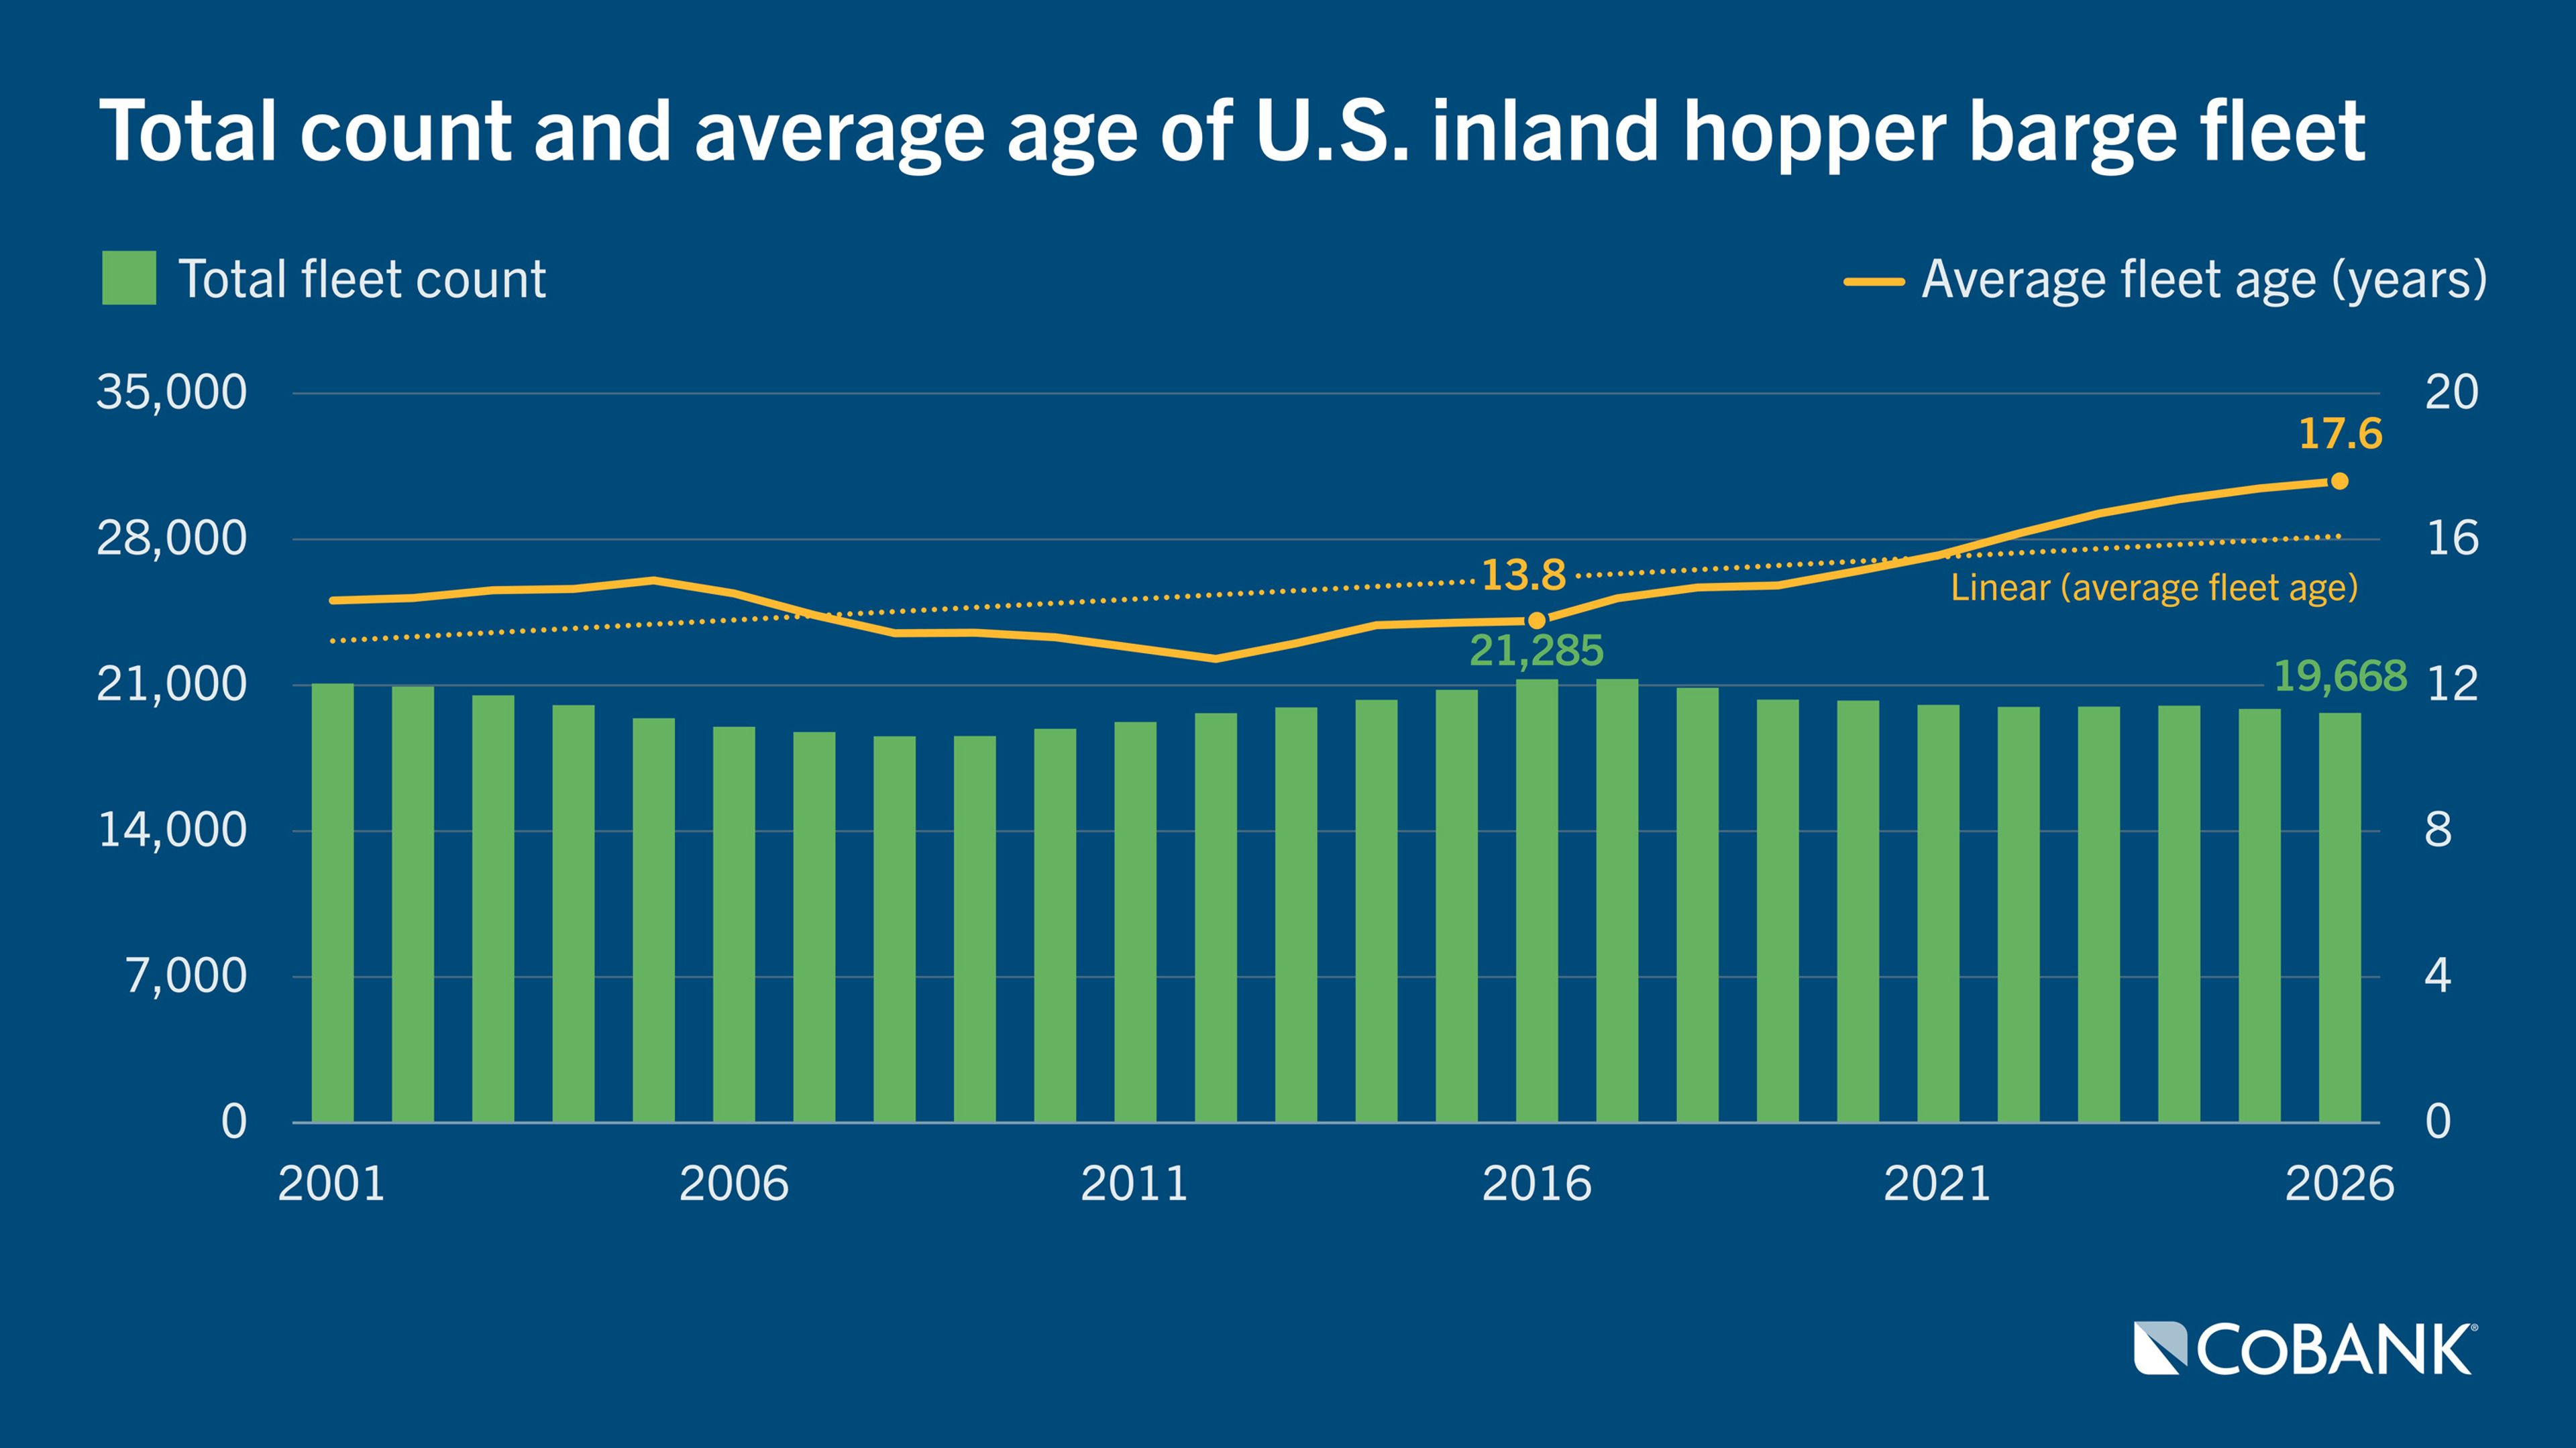
Inland hopper barges generally have a useful life of 25 to 30 years before corrosion and wear weaken their steel hulls. While some operators extend vessel life by replacing sections of the hull, only about 100 to 200 barges are replated annually out of a fleet of approximately 19,000, according to Current Data LLC, a commercial vessel database company. Replating can extend a barge’s life by 12 to 15 years, but it is not enough to meaningfully offset fleet aging.
U.S. inland hopper barge fleet by the numbers | |
|---|---|
| Inland barges in 2026 | 19,668 |
| Average fleet age | 17.6 years |
| Typical useful life | 25–30 years |
| New barges built annually | 410 |
| Annual retirements | 500–1,000 |
| Projected fleet size by 2035 | 16,240 |
The U.S. inland hopper barge fleet numbers 19,668, down 1,617 barges or 7.6% in the last 10 years, according to Current Data LLC. The average age of the fleet, meanwhile, has risen to 17.6 years, up from 13.8 years in 2016.
High replacement costs slow fleet renewal
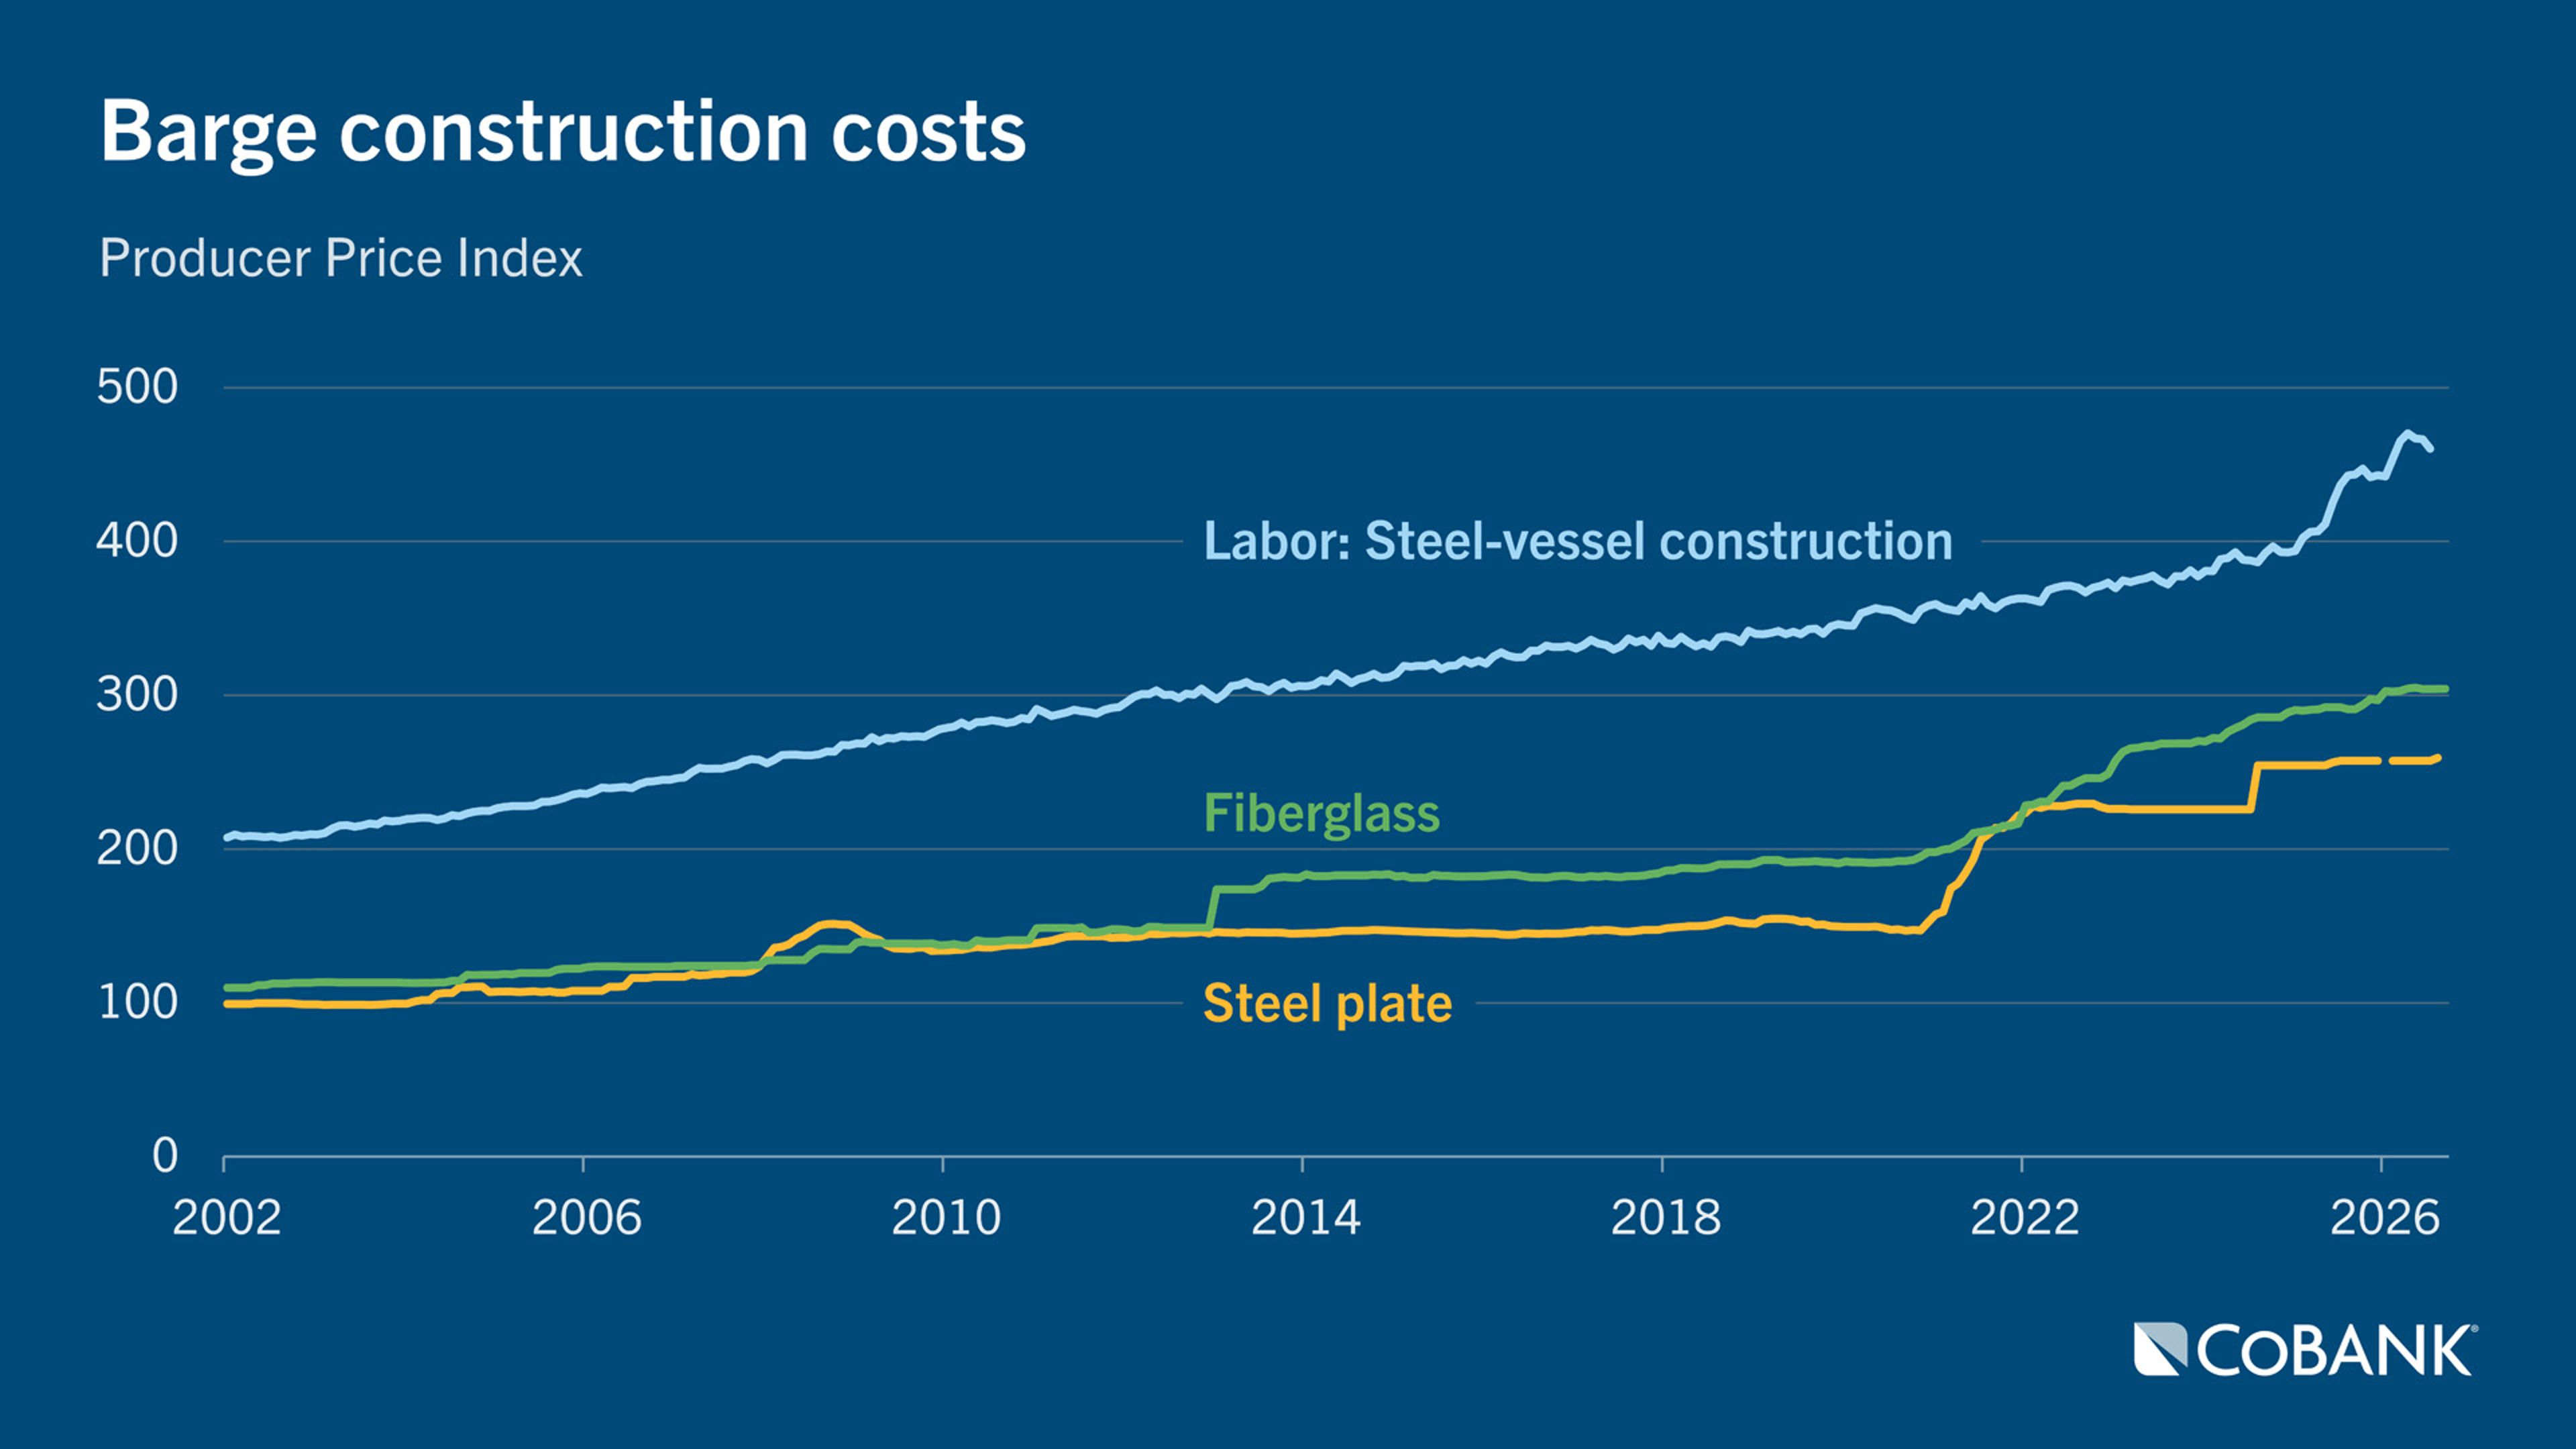
Why hasn’t replacement capacity kept pace with barge retirements? Ballooning costs are a major obstacle to fleet renewal. Steel is the single largest input in barge construction, and prices remain elevated due to strong domestic demand and long-standing Section 232 steel tariffs. U.S. steel plate prices are significantly above global alternatives, increasing the cost of new vessel construction. Labor, fiberglass, financing and interest costs have also risen. As a result, the cost to build a new inland hopper barge has climbed to roughly $1 million or more, according to Opentug.
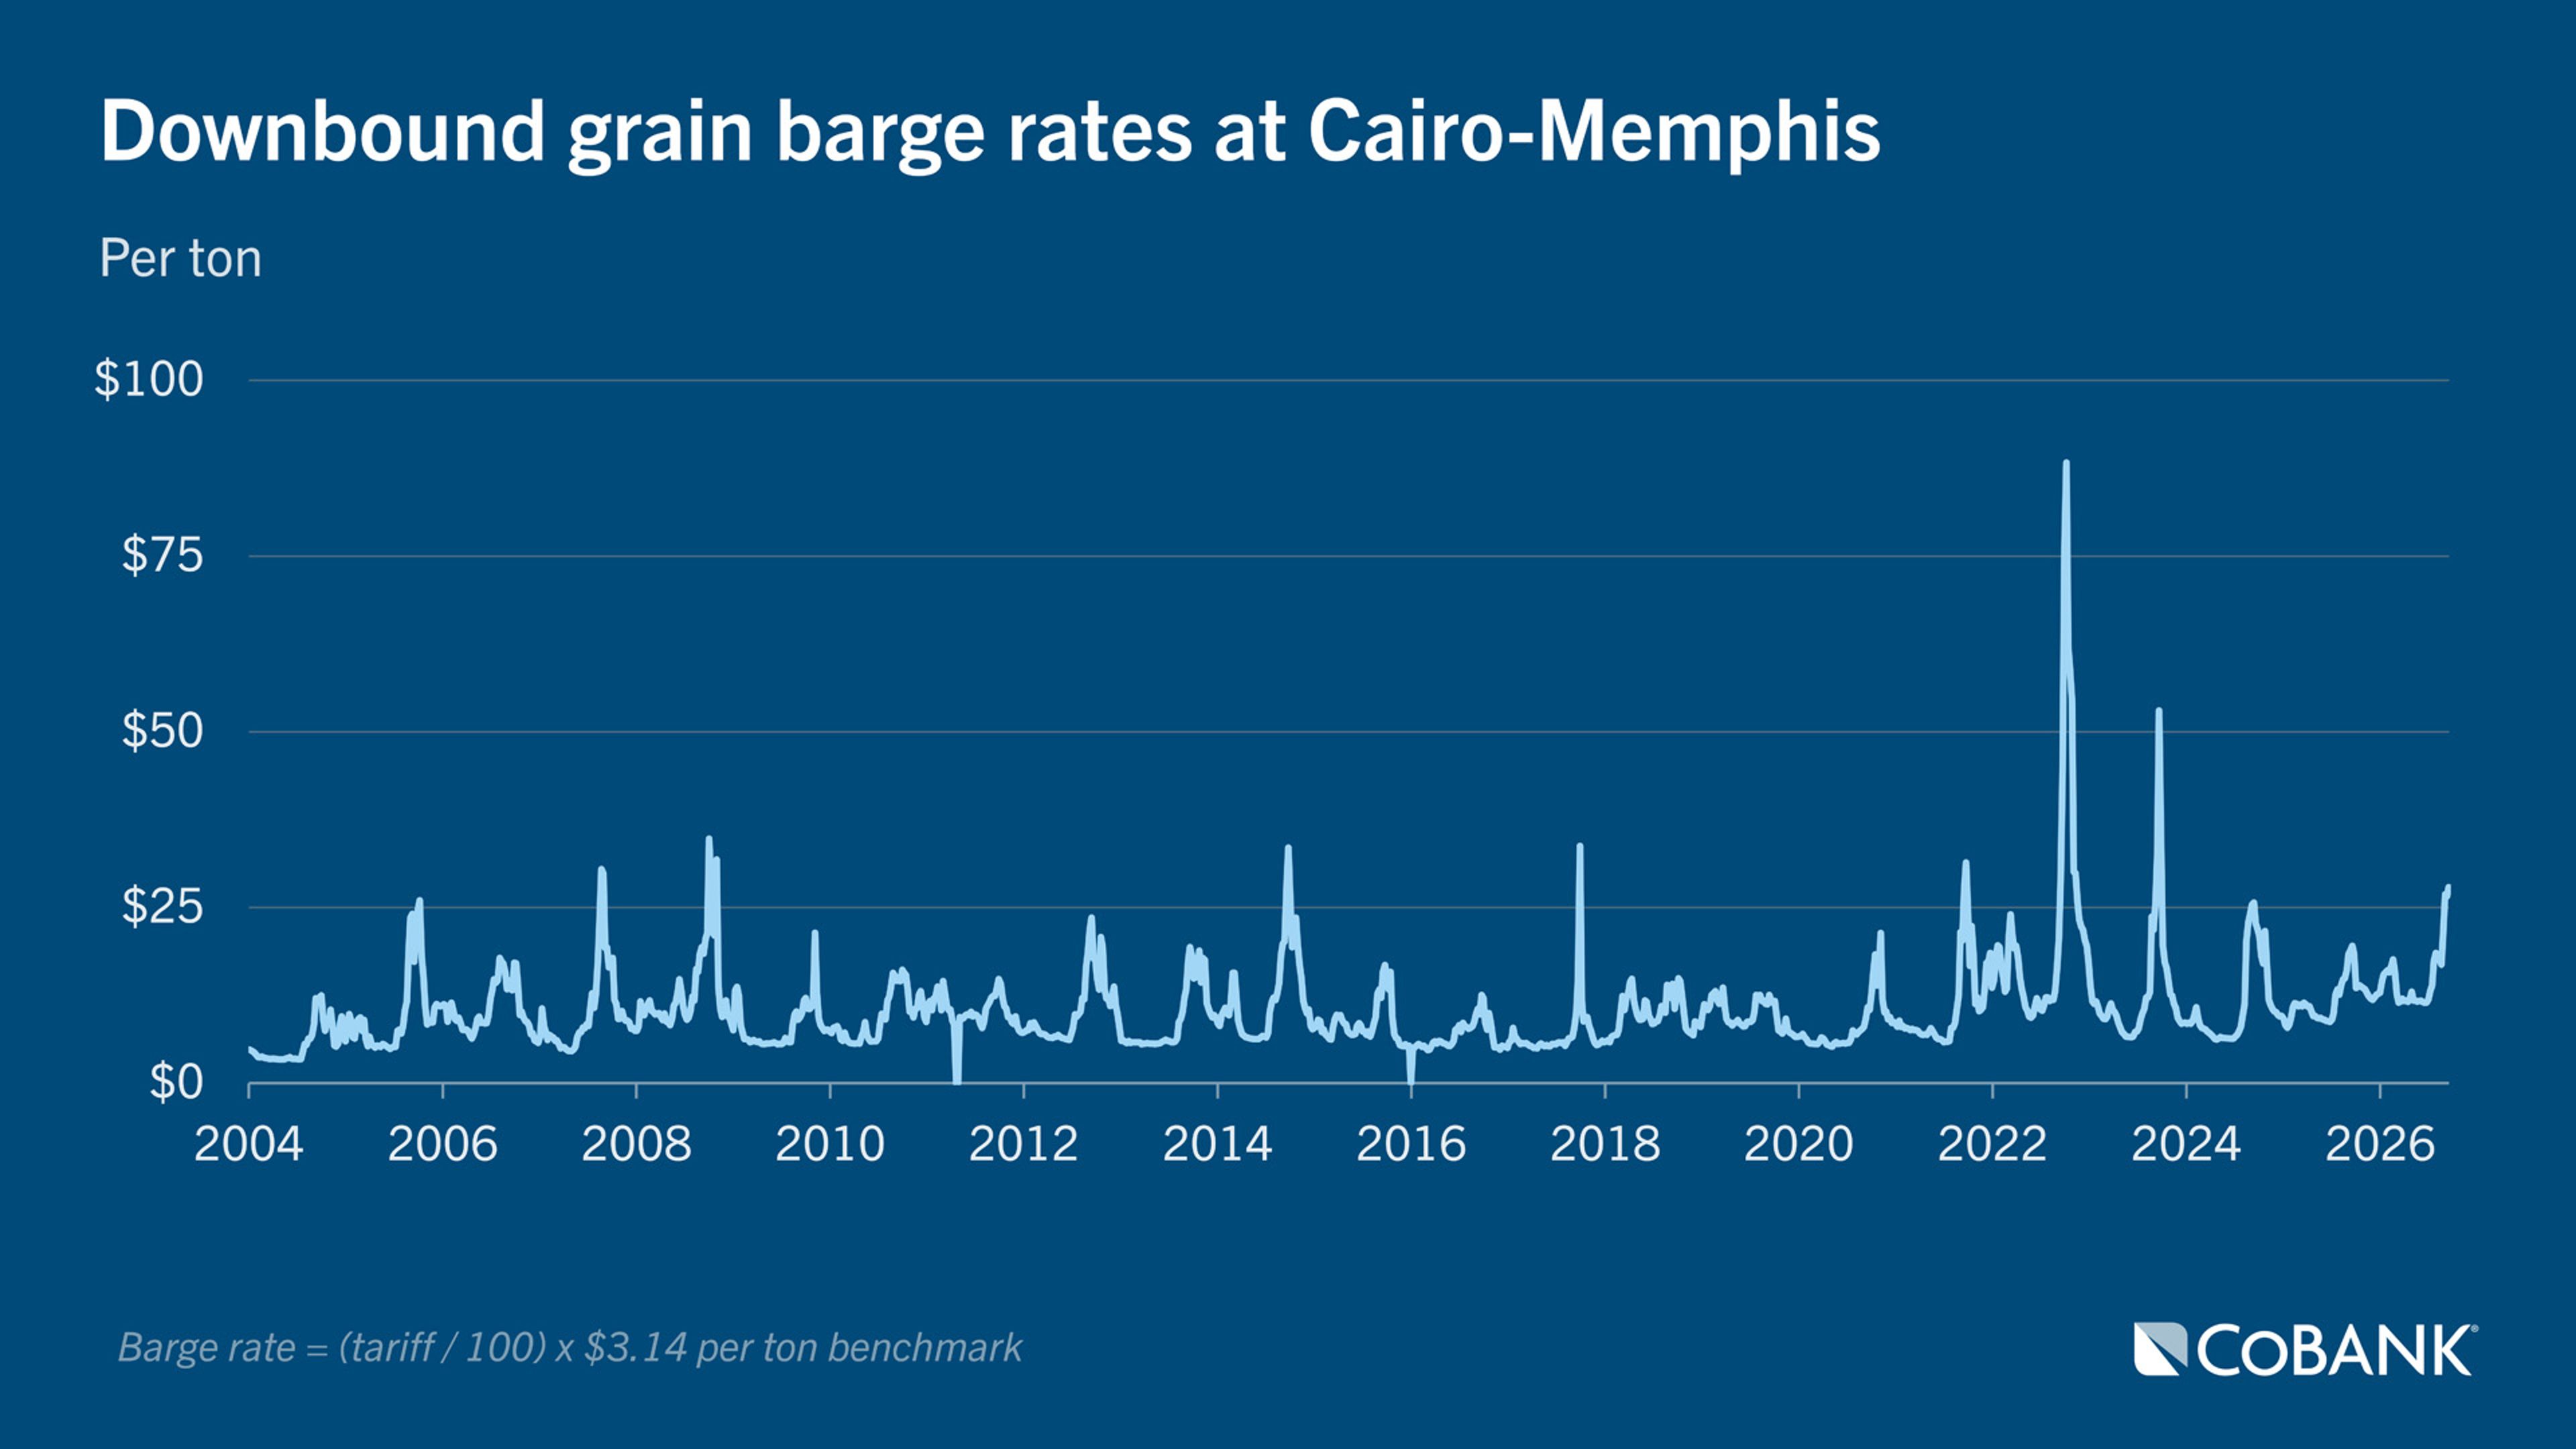
The economics of replacement remain challenging. Although the barge and grain industries widely recognize the retirement wave, operators are hesitant to invest at current construction costs with steel, fiberglass and labor at record highs. Higher newbuild costs put upward pressure on required freight rates over time, but freight markets remain cyclical. While freight rates have increased in recent years, they have not risen to levels that fully justify large-scale fleet replacement.
At the Cairo-Memphis location on the Mississippi River, the three-month average barge rate of $20.04 per ton has climbed above the three-year average of $18.37 per ton for the same point in the year, based on tariff rates published by USDA’s Agricultural Marketing Service. Rates, though, are volatile. Crop size, export demand, domestic demand, diesel costs, river conditions and industry consolidation can outweigh replacement-cost economics in any individual year.
Many operators are also pricing transportation services based on older, fully depreciated barges purchased years ago at substantially lower costs. As a result, many barge operators continue focusing investment on extending the life of existing assets rather than expanding their fleets.
A shrinking fleet could push freight rates higher
The combination of an aging fleet, slow replacement rates and rising asset costs points toward higher freight rates over time. Freight values already exceed historical norms, even during periods traditionally considered offseason. While higher freight rates may encourage additional new construction, transportation costs will likely trend upward over the long term as retirements outpace new builds.
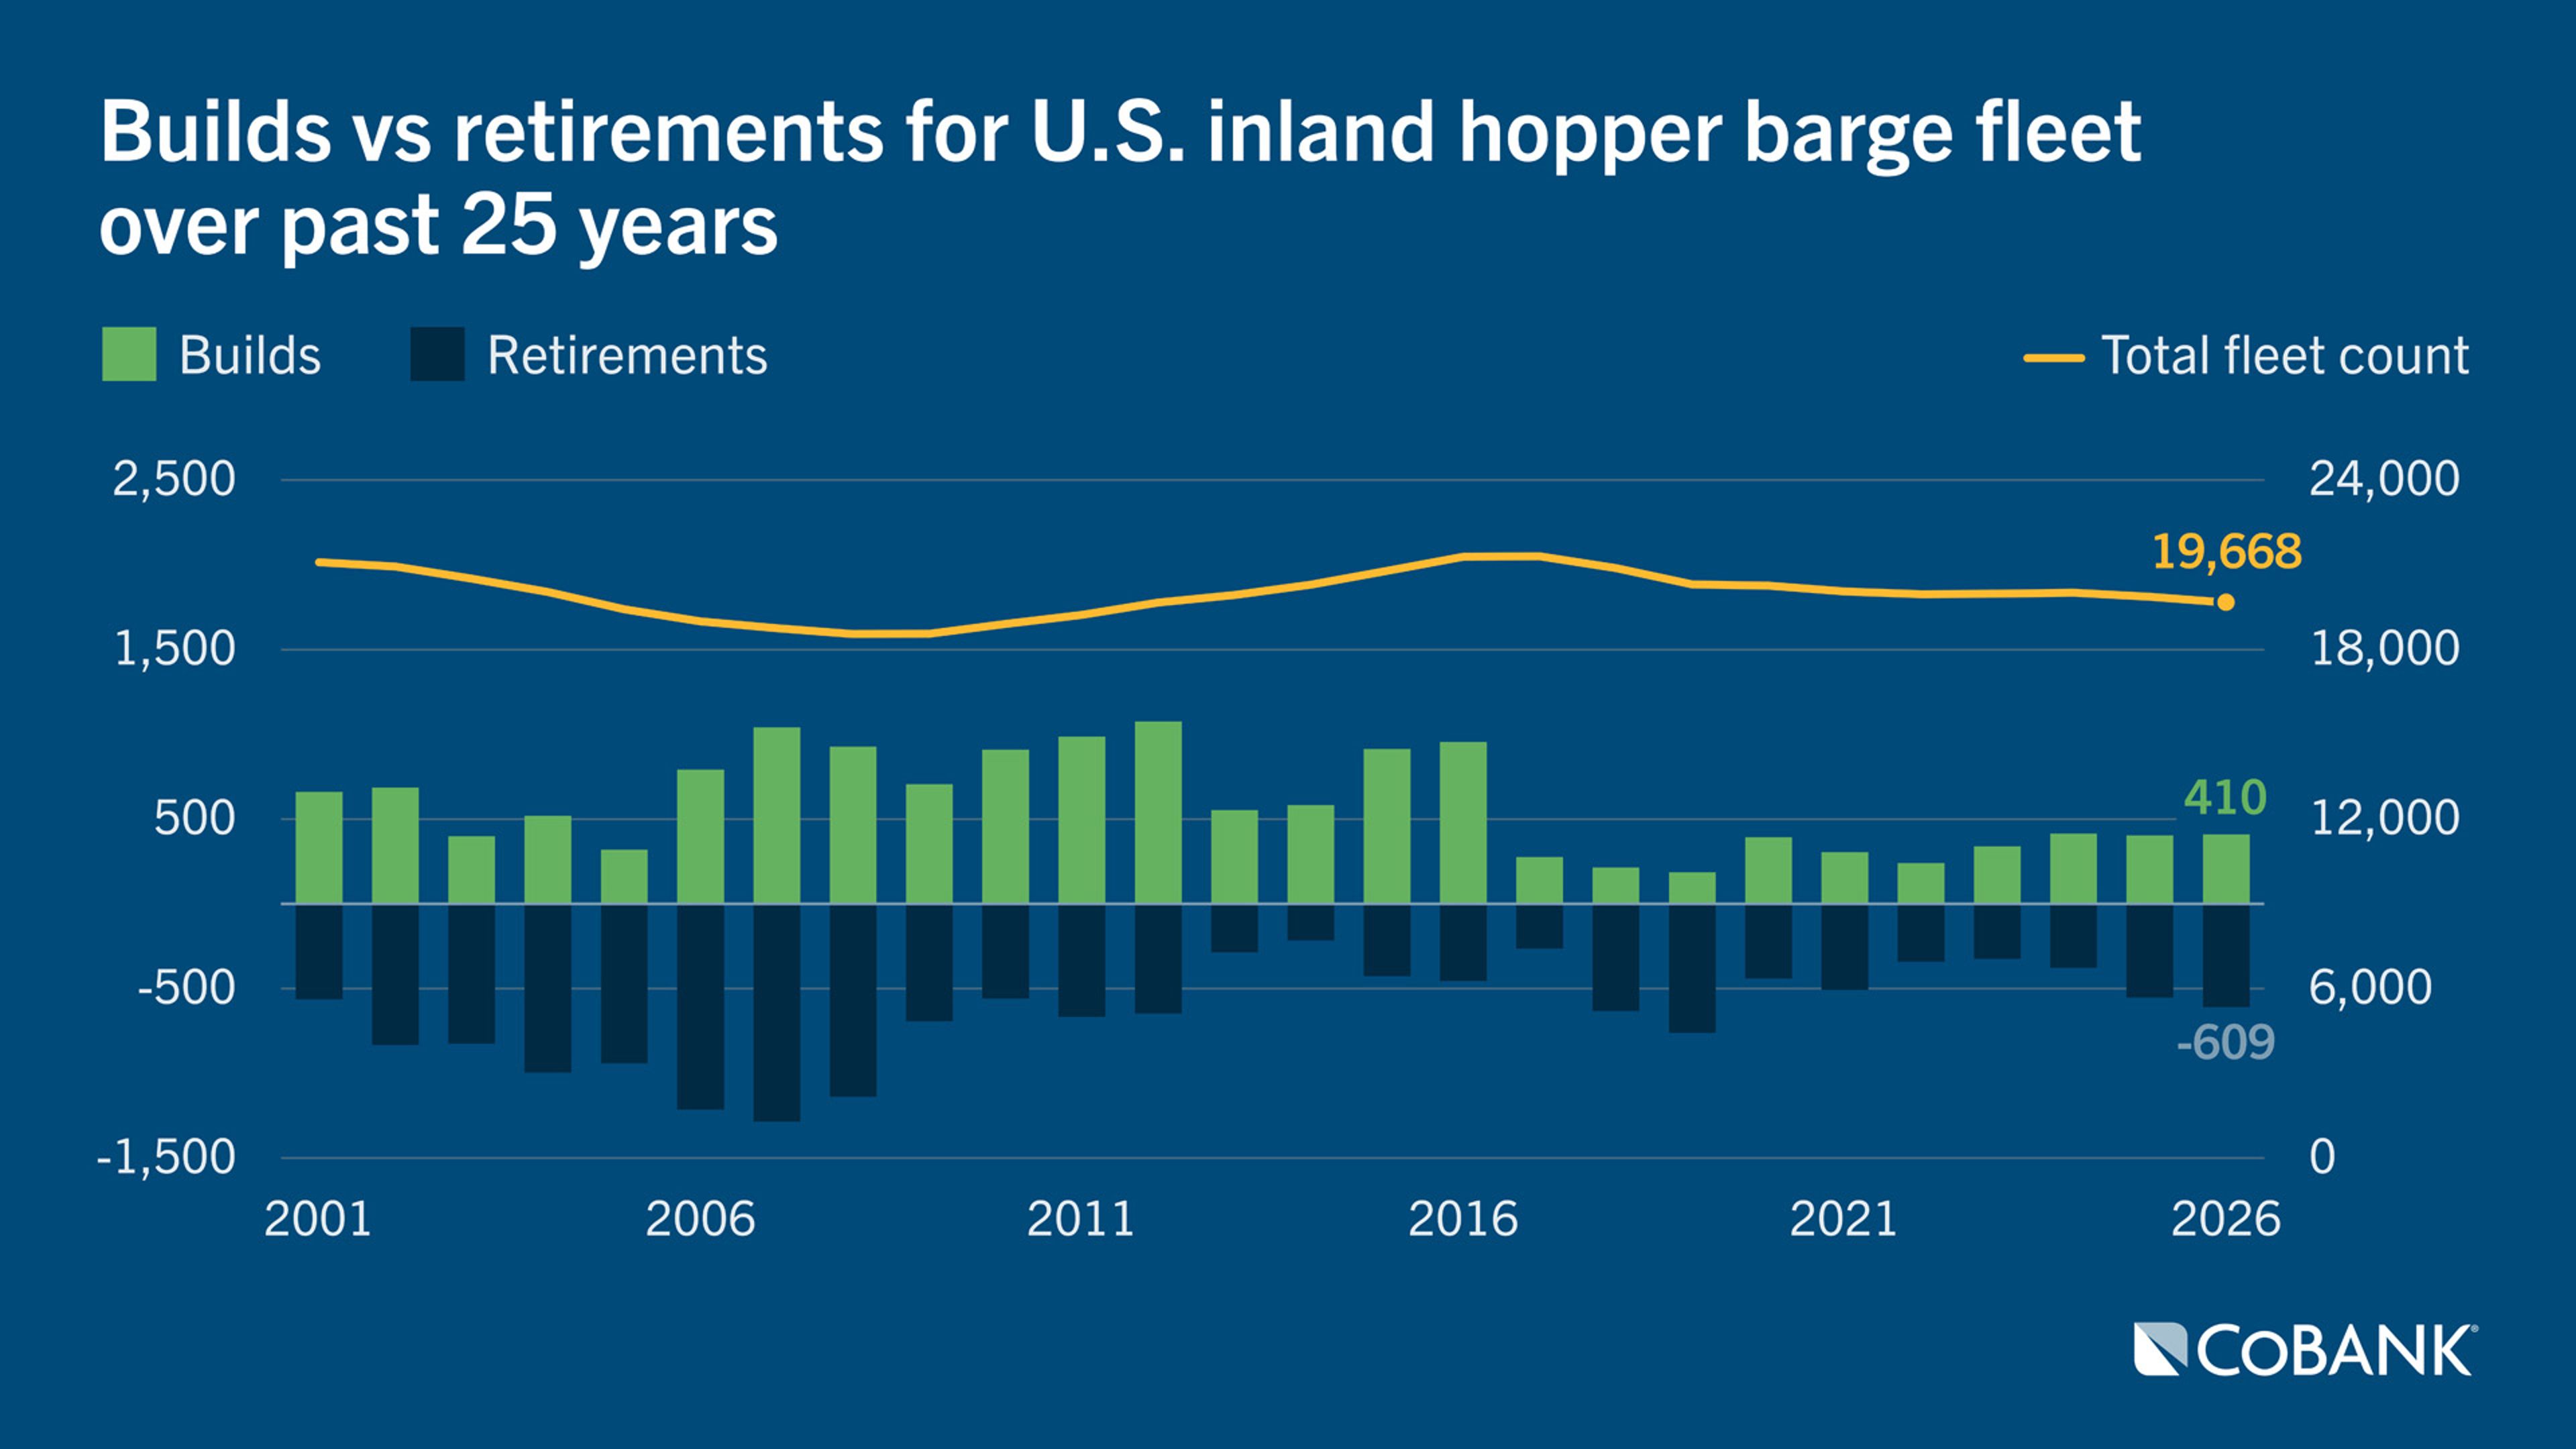
As older, lower-cost barges leave service and more expensive replacement vessels enter the market, transportation costs will increasingly reflect today’s higher construction costs. Operators may extend existing assets until freight economics justify new construction.
Newer barges provide quality advantages over older vessels. While older barges are more prone to leaking from damaged hulls and covers, raising the risk of grain spoilage and quality discounts, new barges reduce grain shrink and quality-related rejections during transit, creating cost savings for shippers.
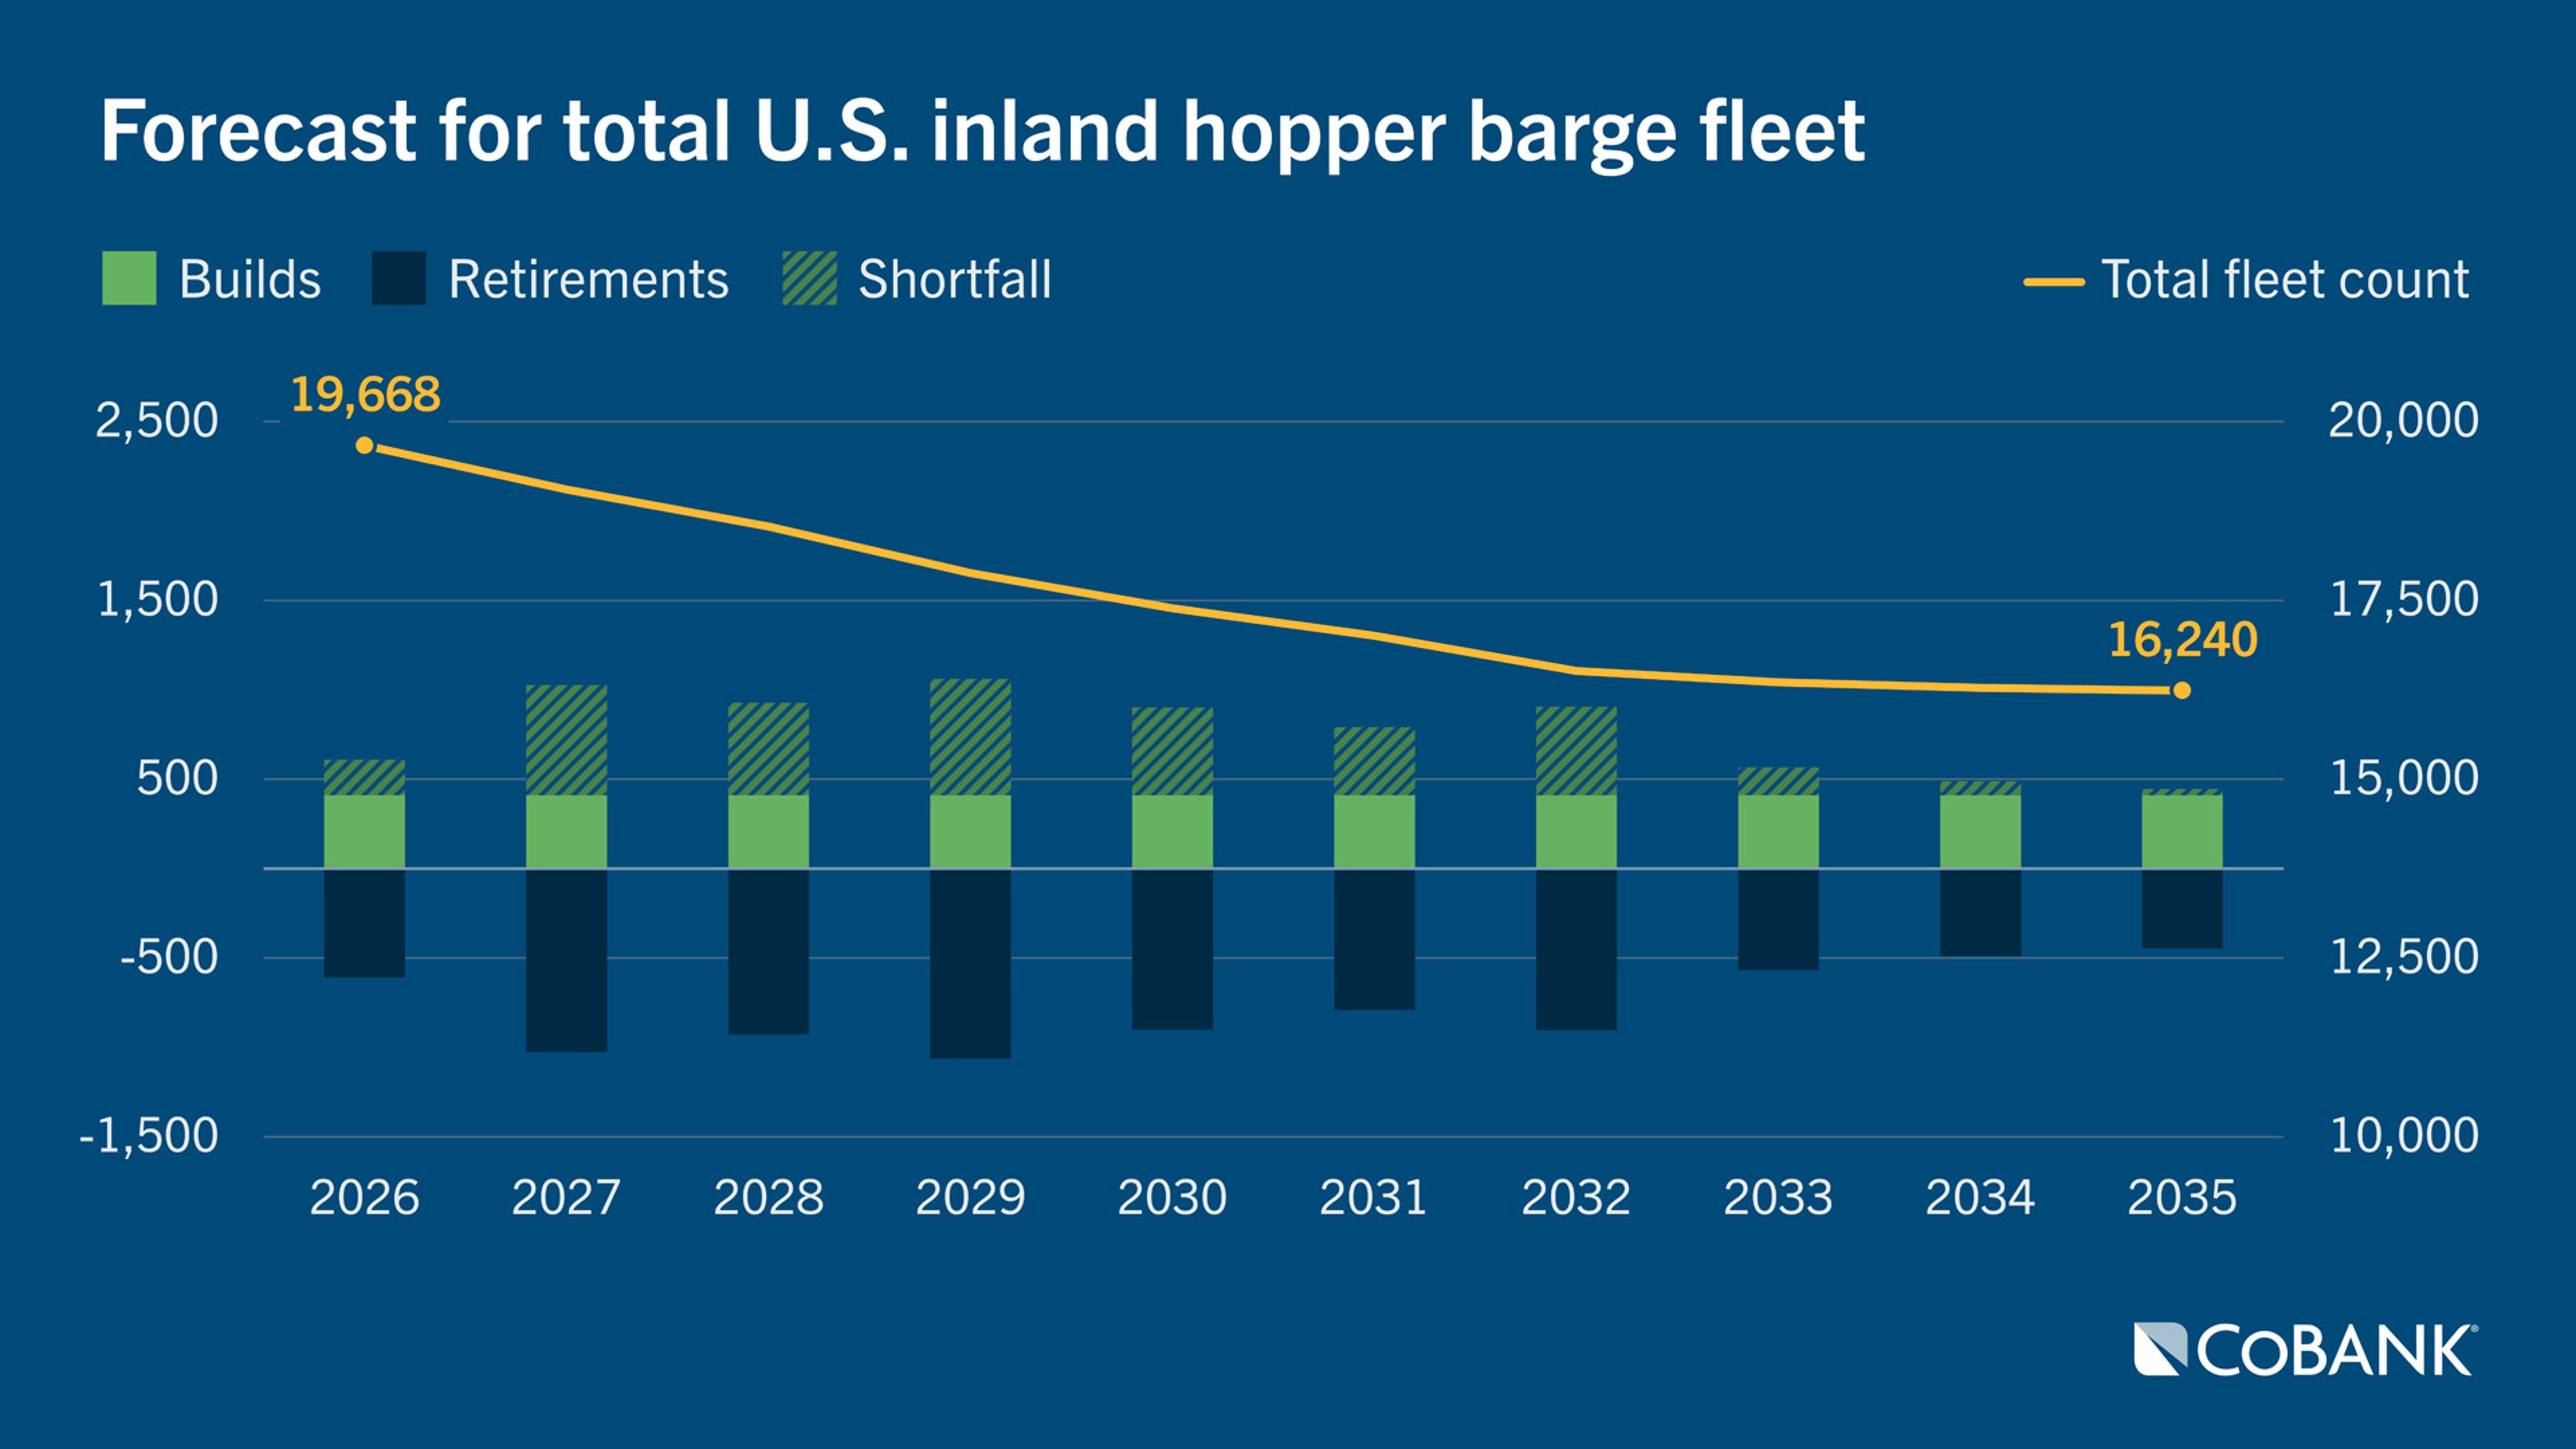
At an estimated build rate of 410 new barges per year with roughly 500 to 1,000 barge retirements per year based on current fleet age, Current Data LLC projects the total barge fleet will shrink to 16,240 barges by 2035 — down 17.4% from current levels. The forecast assumes current trends for retirements, replacements and demand for barge capacity remain steady.
Rail offers limited relief
Railroads provide some competition to river barge transportation but cannot fully replace the system. Railroad capacity can absorb only a small share of barge traffic due to equipment constraints, terminal bottlenecks and capacity limitations at export facilities.
Barges are also significantly more efficient than rail for loading bulk commodities. Grain can be unloaded from a barge much faster than from a shuttle train, and the river system handles volumes that would be difficult for railroads to replicate.
As a result, rail and other transportation modes cannot replace the inland barge system in the case of a major disruption to grain movement. Any sustained reduction in barge capacity would trigger an increase in transportation costs across the grain supply chain.
Low water and aging infrastructure compounds risks
Successive years of low water on the Mississippi River have raised concerns over the viability of moving grain via barges. During periods of reduced river levels, operators cannot load barges to full capacity and must reduce tow sizes.
Tighter barge availability ultimately raises freight rates and weakens grain basis levels paid to farmers. When barge freight rises, elevators often bid less aggressively for grain because more of the export value is absorbed by transportation costs. That weaker bid shows up as lower local basis for farmers.
Higher transportation costs also delay grain movement, forcing more grain into storage and widening seasonal basis carries, which ultimately defer grain shipments to relieve short-term pressure on freight demand.
Infrastructure challenges add another layer of risk. Aging locks and dams remain vulnerable to disruptions, which can create significant delays and reduce system efficiency. While the U.S. Army Corps of Engineers continues dredging operations and maintenance efforts, the system requires ongoing investment.
The recently proposed Water Resources Development Act of 2026 would provide more than $6 billion for ports, waterways and related infrastructure projects. If enacted, the legislation could help improve system reliability and accelerate critical upgrades. The bill is currently being debated in Congress.
Export growth adds pressure to barge capacity
Rising demand for U.S. exports will add further pressure on the Mississippi River inland barge system in the coming decade. USDA projects U.S. grain and oilseed exports will rise 9% by 2035 from current levels, with the bulk of the increase coming from corn and soybeans, according to USDA Agricultural Projections to 2035. The report is based on long-term assumptions for U.S. and international macroeconomic conditions, U.S. and foreign agricultural and trade policies, and growth rates in crop productivity.
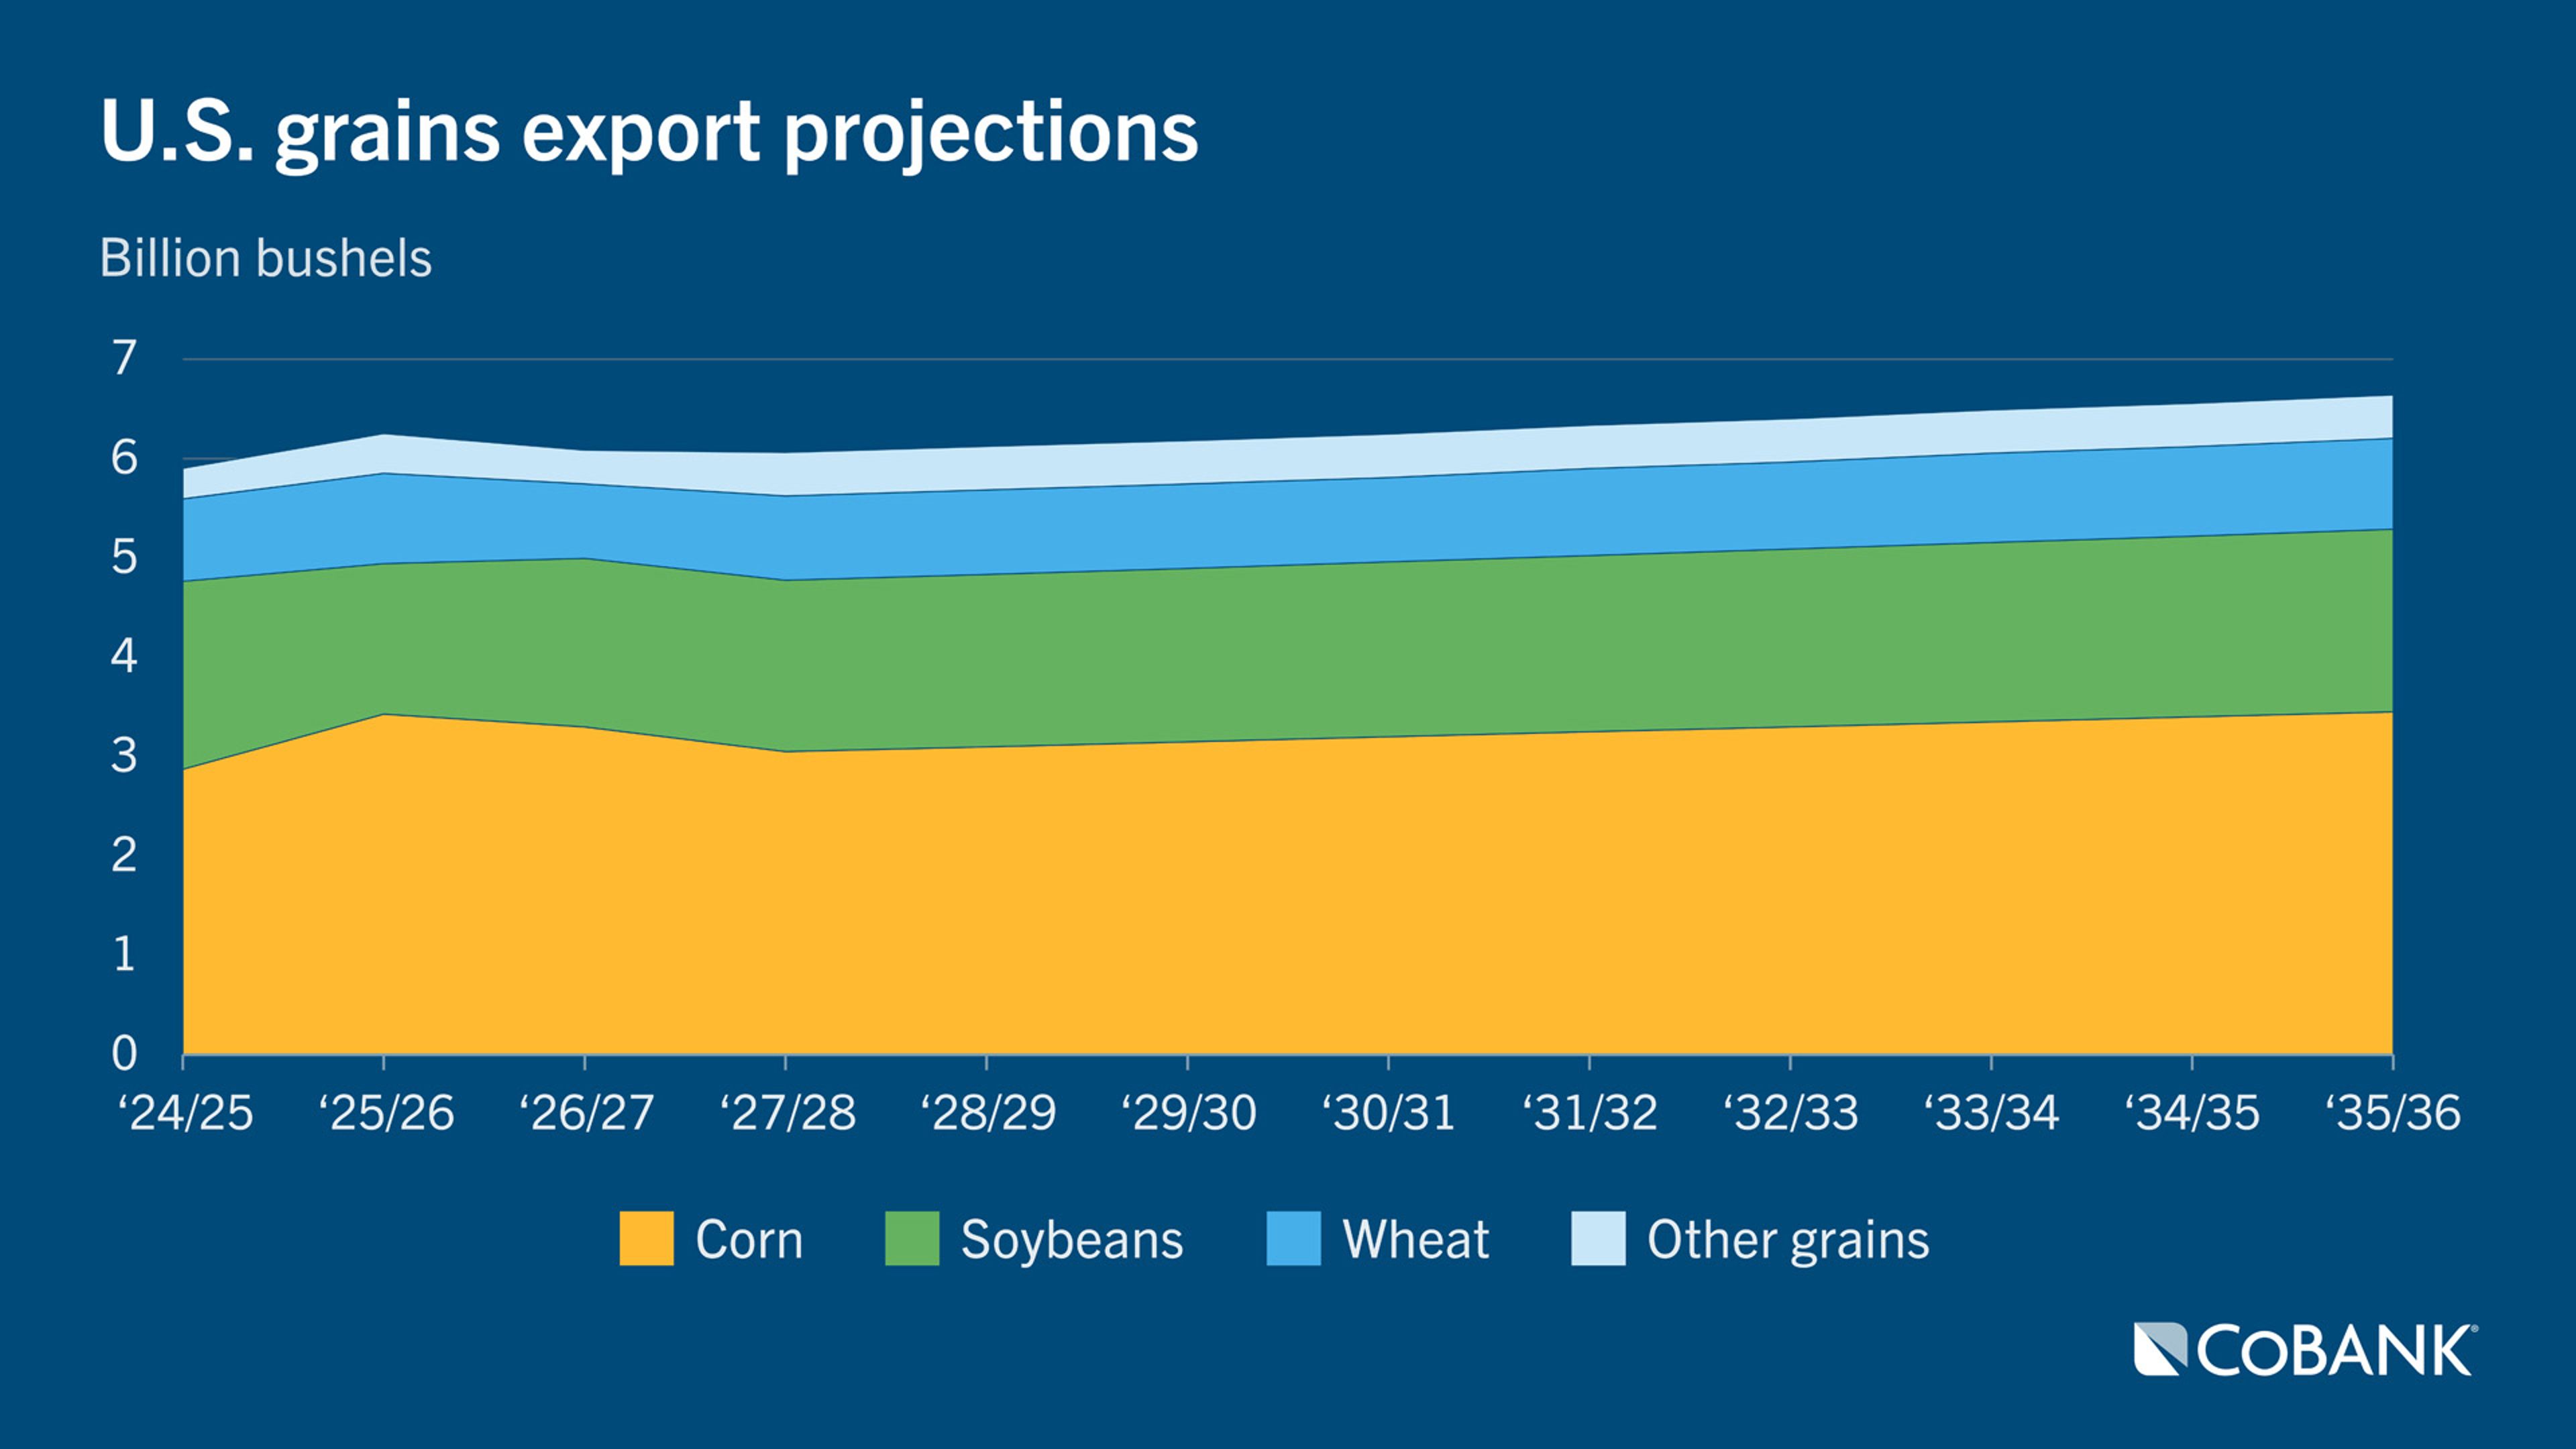
Continued growth in U.S. corn yields is seen as the primary tailwind for corn exports, with USDA forecasting exports will gradually climb to a new record by 2035/36. Soybean exports are expected to rise moderately but remain below the record volume exported in 2020/21 due to an expected expansion of Brazilian soybean production and exports while global consumption growth slows, especially in China.
U.S. wheat exports are expected to steadily rise with global incomes, particularly in emerging economies with rising per capita demand. Growth in U.S. wheat exports, though, will be limited by continued large exportable supplies among key global competitors. Exports of sorghum, rice, barley and oats are largely projected to remain flat over the next decade.
Investment is key to long-term competitiveness
The inland hopper fleet is aging, and elevated replacement costs may create capacity and transportation-cost pressure over the long term. The timing and magnitude of that pressure will depend on commodity demand, river conditions, operating costs, infrastructure reliability and the pace of fleet replacement and life-extension investment.
As older, lower-cost equipment leaves service, replacement-cost economics may place upward pressure on the freight rates required to support new investment. Actual freight rates, however, will remain cyclical and can vary materially with crop size, export and domestic demand, fuel costs, river conditions and available capacity.
Without continued investment in hopper fleet replacement and waterway infrastructure, higher transportation costs could pressure farm margins, grain basis levels and U.S. export competitiveness. These outcomes are not driven by fleet age alone and will depend on broader commodity, demand, operating cost and infrastructure conditions.
Disclaimer: The information provided in this report is not intended to be investment, tax, or legal advice and should not be relied upon by recipients for such purposes. The information contained in this report has been compiled from what CoBank regards as reliable sources. However, CoBank does not make any representation or warranty regarding the content, and disclaims any responsibility for the information, materials, third-party opinions, and data included in this report. In no event will CoBank be liable for any decision made or actions taken by any person or persons relying on the information contained in this report.