While U.S. leads milk component growth, butterfat may be growing too fast
Key points
- Responding to milk price signals over the past decade coming from consumer demand for more nutrient-dense dairy products, U.S. dairy farms delivered milk with growing levels of butterfat and protein – the components for making cheese, butter and yogurt.
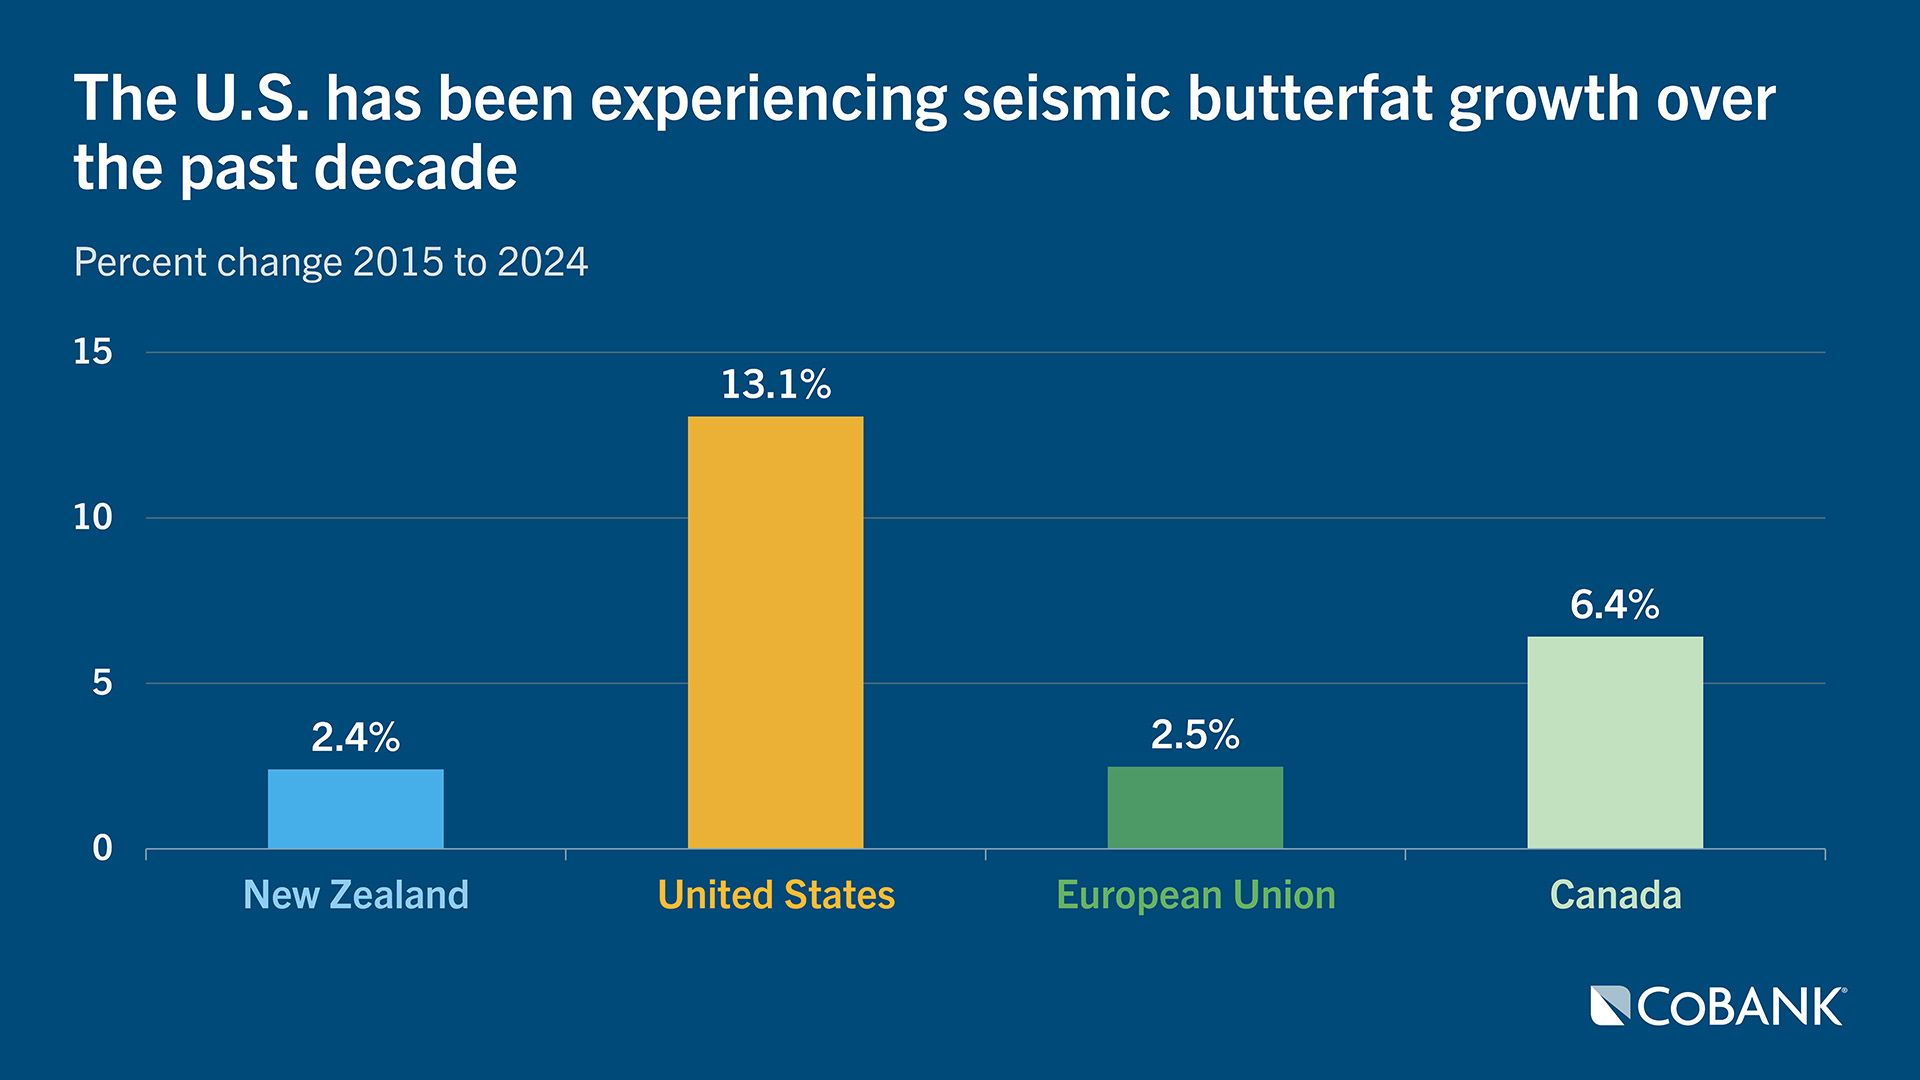
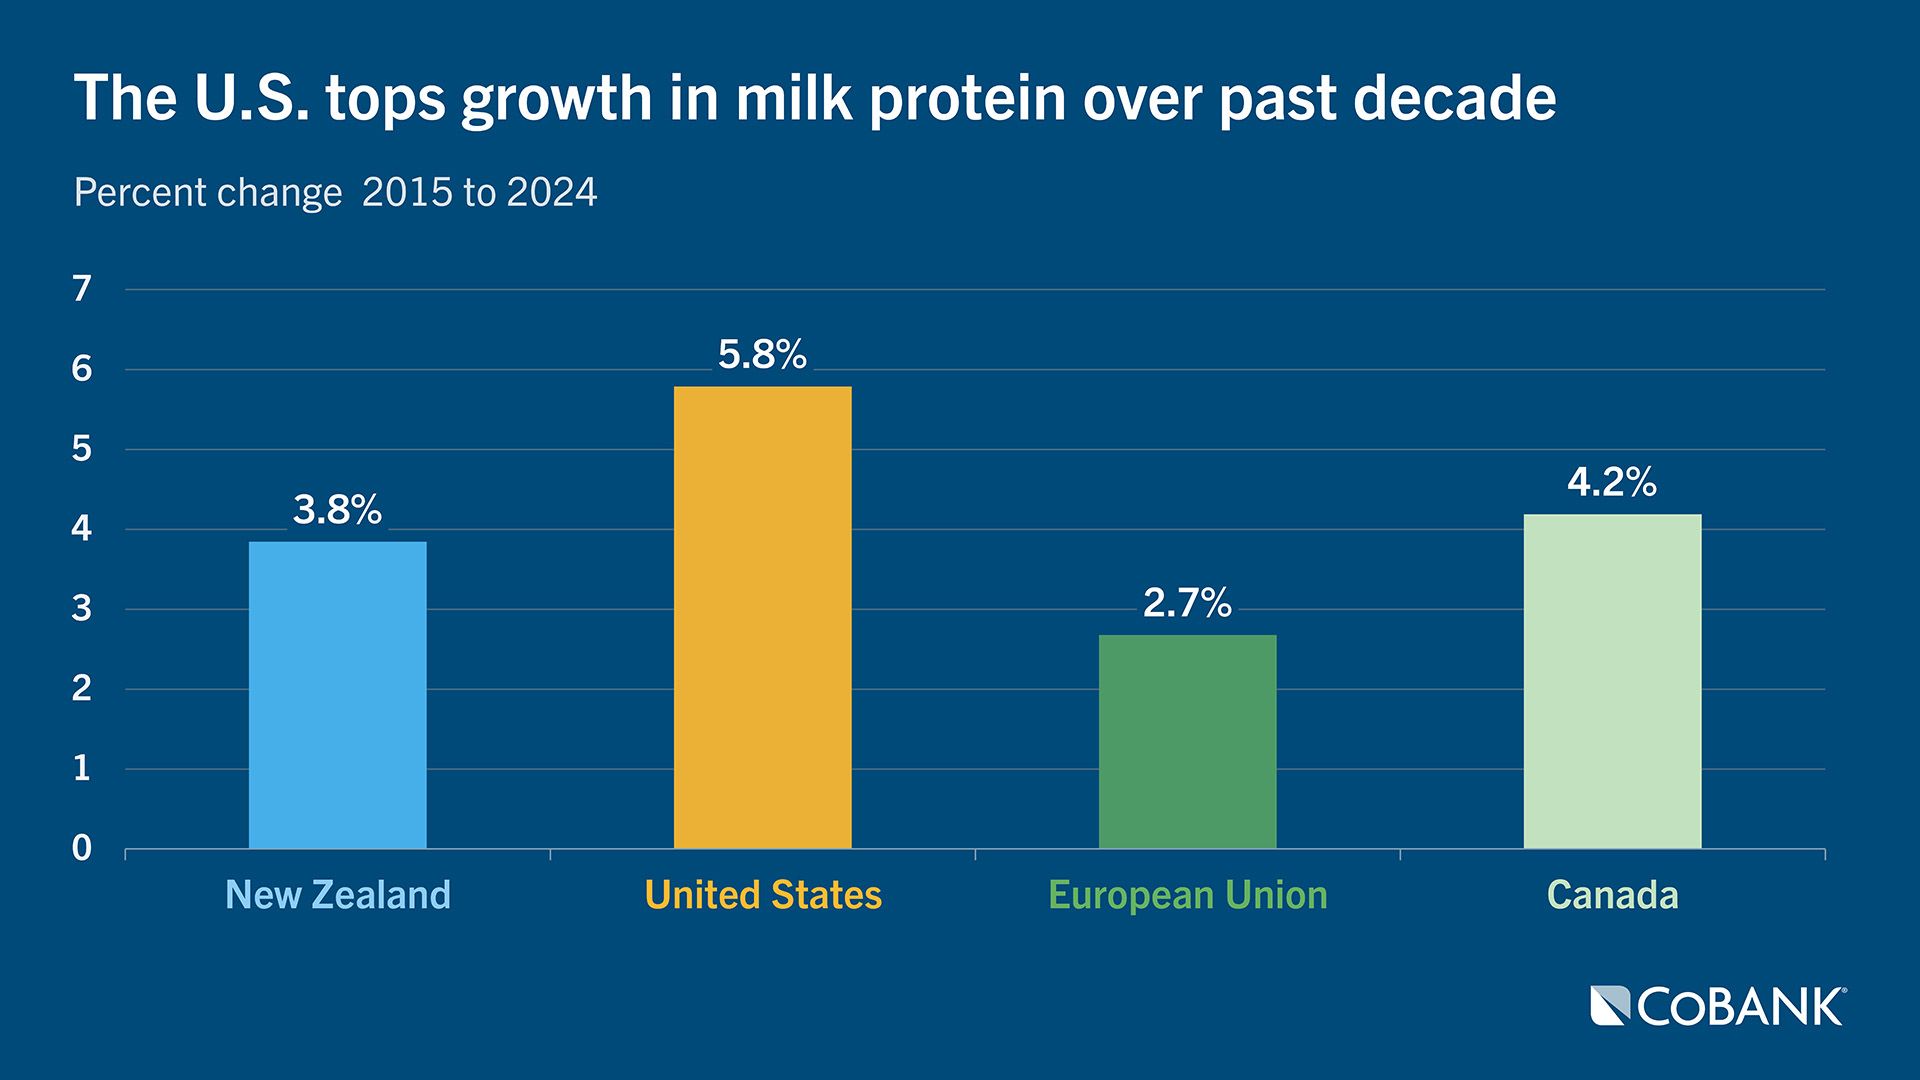
- U.S. butterfat levels leapt by 13% over the past decade — six times higher than the EU and New Zealand, the two largest dairy exporters. Meanwhile, U.S. protein levels climbed 6%, which also led the big three exporters.
- A possible reason for the difference: To boost milk component production, U.S. dairy farmers have adopted genomic testing at higher rates, bolstered by a Holstein-majority dairy herd. In New Zealand and EU, breed composition is far more diverse.
- While the growth of U.S. dairy components is world-leading among major exporters, the growth of butterfat has significantly outpaced protein. Excessive butterfat levels can impact cheese quality.
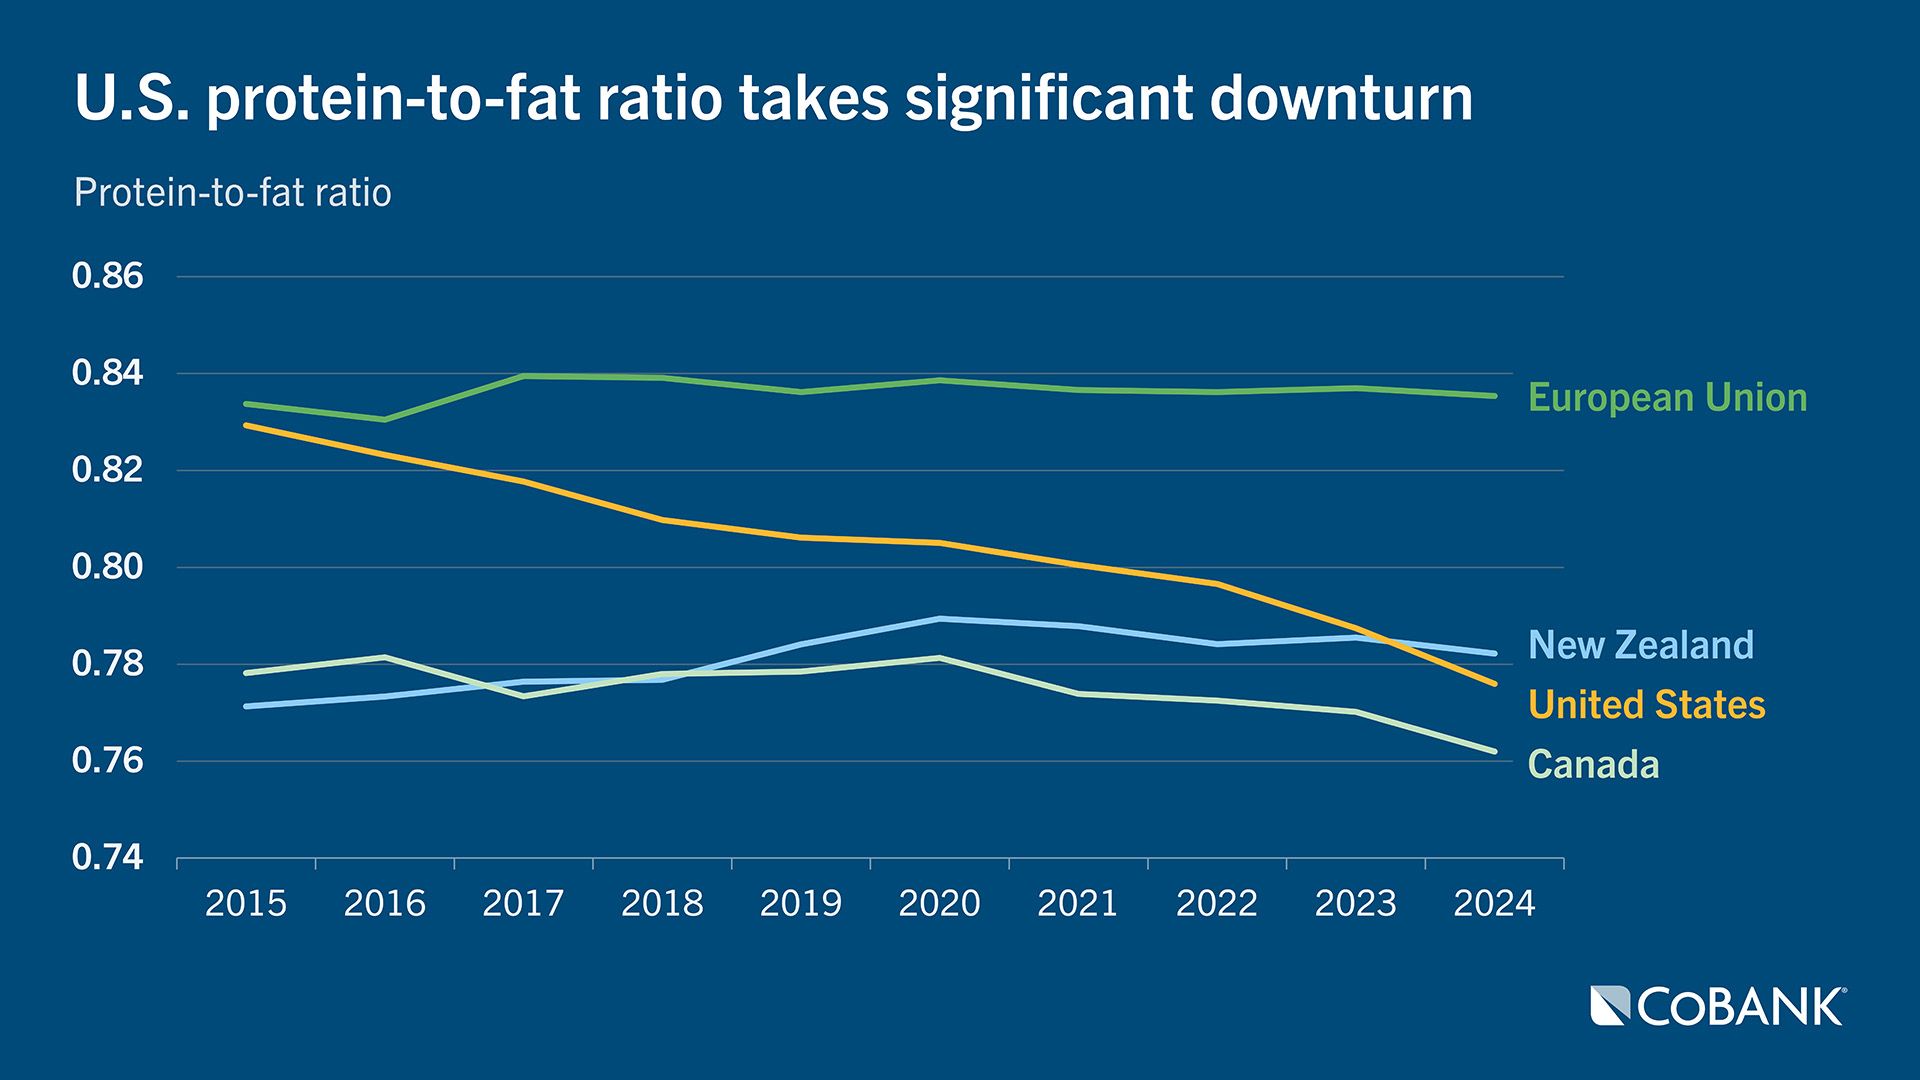
- In the EU and New Zealand, the protein-to-fat ratio has remained far steadier, averting the issues U.S. cheesemakers are facing.
- The answer to the “too much of a good thing” for butterfat has been the U.S. milk standardization requirements. Adjusting pricing incentives and genetic selection to achieve a higher protein-to-fat ratio could improve milk utilization efficiency and cheese quality, aligning production more closely with market demands.
With consumers gobbling up record volumes of yogurt and cheese, demand for the two main components in cow’s milk – butterfat and protein – have been skyrocketing. In the past decade, U.S. natural cheese consumption has grown 15% moving to 40.5 pounds per capita. Meanwhile, yogurt demand has picked up significantly as the category has posted 10% growth in sales in the past 52 weeks, according to DMI and Circana sales data. Likewise, cottage cheese sales were up 14% during the same window and butter has grown 3.5%. Butter’s story is even more impressive considering the past decade of data as per capita consumption has grown 18% to reach 6.5 pounds per person, according to USDA data.
While agricultural products evolve over time due to weather and genetics, cow’s milk may be the most dynamic of them all when looking at the improved nutritional profile. In the past decade, milk delivered to U.S. dairy processing plants has become more nutrient-dense as higher butterfat and protein levels in cow’s milk now yields more product, pound-for-pound. One primary reason for this shift is the cost effectiveness of delivering more component-dense milk with minimal water content. As an example, 100 pounds of U.S. cow’s milk yielded 10.4 pounds of Cheddar cheese in 2010 compared to 11.4 pounds in 2024, for a 12.5% gain. Meanwhile, butterfat yields from the same 100 pounds of milk have moved from 4.4 to 5.1 pounds for a nearly 16% improvement.
This unfolding component trend has become particularly important for U.S. dairy farmers and processors as the U.S. has become the world’s third largest dairy product and ingredient exporter. Given these shifting market dynamics in the U.S., what do milk component trends look like for our competitors and the world’s top two global exporters, the European Union and New Zealand?
Laser focused on exports
No country knows dairy exports better than New Zealand, as the country sends nearly 95% of its 45.2 billion pounds of annual milk production on ships and planes. As a result, nearly one-third of the country’s total exports are dairy products and ingredients when measured by Gross Domestic Product.
It's also the reason New Zealand dairy farmers produce cow’s milk with some of the world’s highest milk components. Processors find marginal value in the water found in milk as nearly all its farmgate milk goes into manufactured dairy products. Hence, the nation solidified a pricing plan based on kilograms of milk solids (kg/MS) in the early 2000s to better reward dairy farmers for shipping milk with higher butterfat and protein levels.
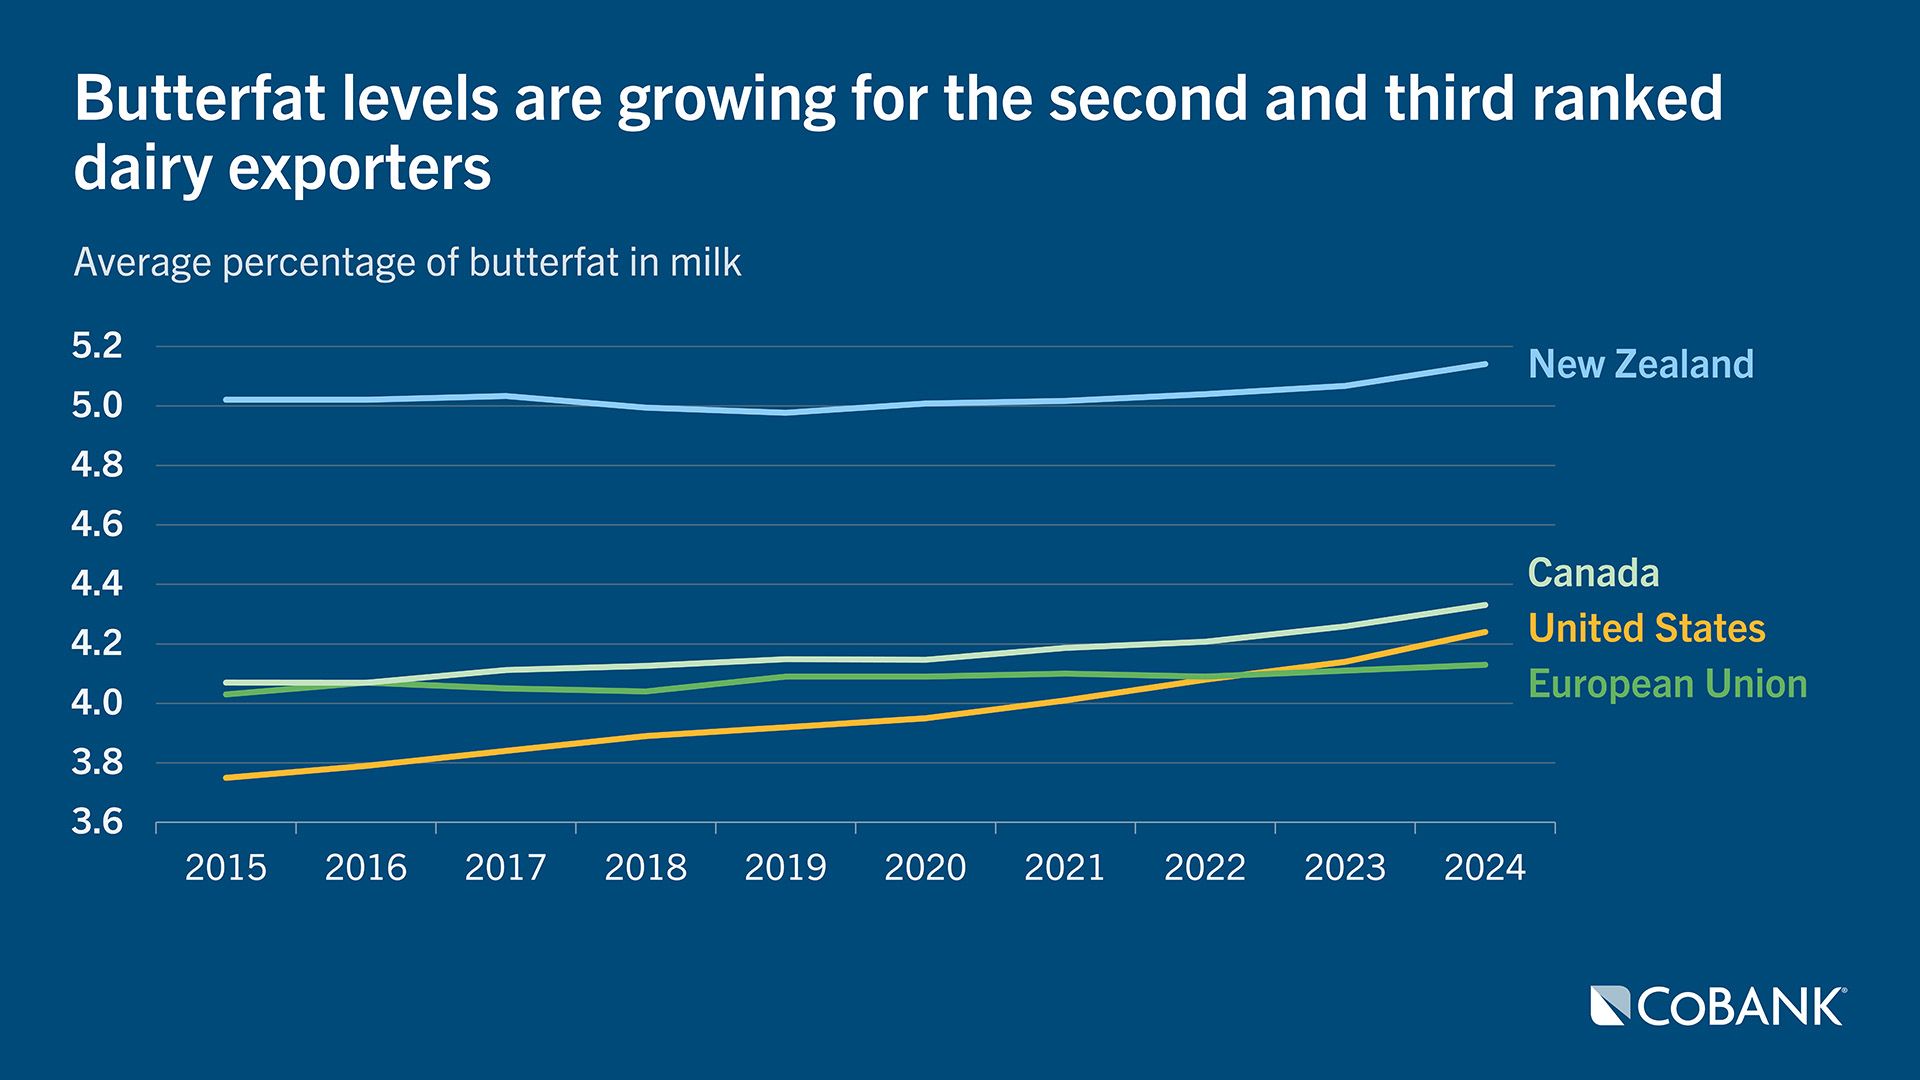
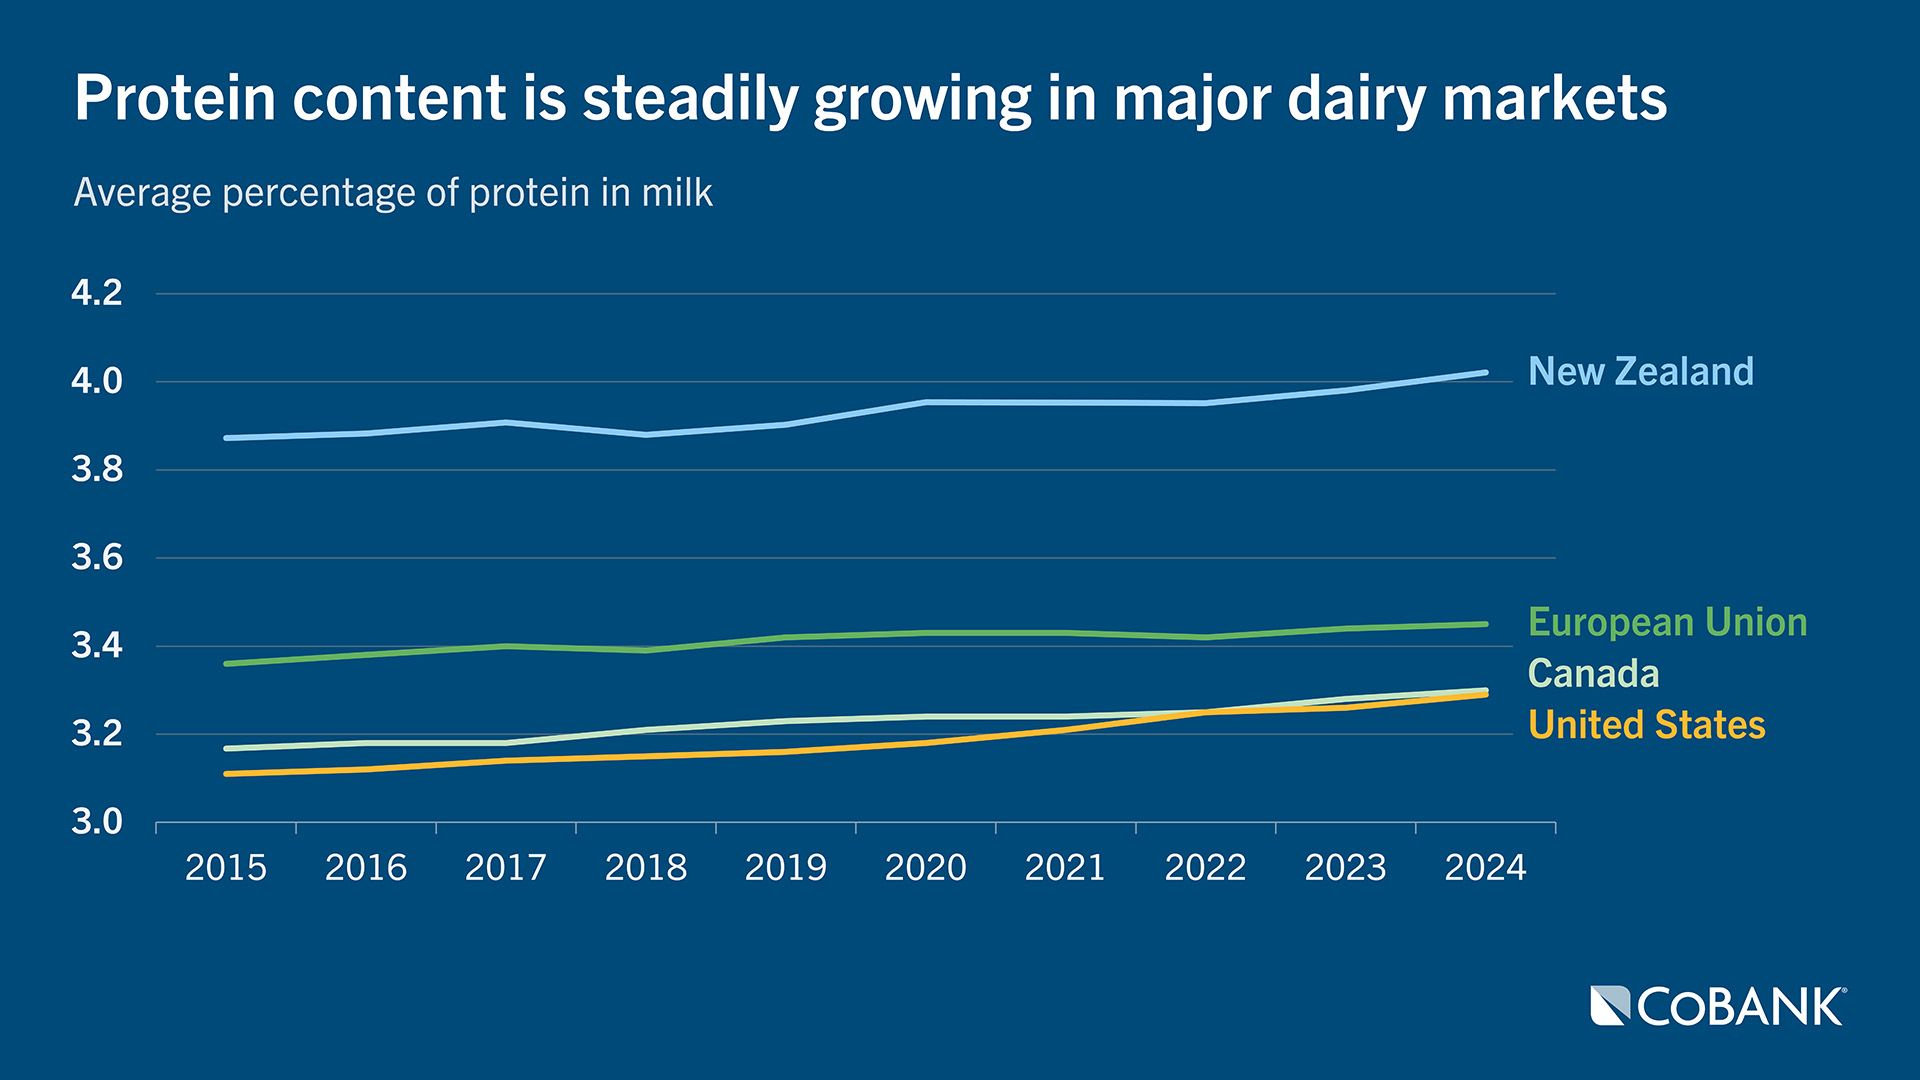
Over the past decade, the New Zealand milk supply butterfat content improved from 5.02% in 2015 to 5.14% by 2024. In contrast, U.S. butterfat levels grew from 3.75% to 4.24% during that same time. Meanwhile, protein content in New Zealand milk moved from 3.87% to 4.02% during that 10-year window, while U.S. protein levels climbed from 3.11% to 3.29%.
While genetics, genomics, and feeding programs have been the main drivers of change in the U.S., in New Zealand the key is breed composition. In New Zealand, 60.4% of the nation’s dairy cows are Holstein-Friesian/Jersey crossbreeds or what many in that industry call the “KiwiCross.” This is a significant factor for New Zealand’s world-leading milk components in cow’s milk. The remaining breed compositions include Holstein-Friesian, 23.9%; Jersey, 7.5%; other breeds, 7.8%, and Ayrshire, 0.4% based on data from New Zealand Dairy Statistics 2023-24 published by Dairy NZ and LIC. Additionally, New Zealand dairy farmers have been moving to improve component levels by supplementing pasture-based feeding with palm kernel extract and other feedstuffs.
Higher starting plane, but slower growth
Most of the world’s modern-day dairy processing traditions trace back to the European continent. The collective 27 countries of the European Union ranked as the world’s largest producer of cow’s milk with 321 billion pounds delivered to dairy processors in 2024, according to CLAL and Eurostat data. These contributions rank the economic union of 27 countries as the world’s largest dairy product exporter sending 20% of its milk production, via dairy products and ingredients, to customers around the world.
Given that focus on exports, it would stand to reason that the EU would also be experiencing significant growth in milk components. However, that isn’t the case. Among the EU 27, butterfat composition grew from 4.03% in 2015 to 4.13% to 2024, according to Eurostat data published by CLAL. That contrasts to the topside butterfat percentages of 4.24% in the U.S. and 5.14% in New Zealand in the most recent year. Over the past decade, the U.S. grew its butterfat content by 13.1% compared to just 2.4% and 2.5%, respectively for New Zealand and the EU.
As for protein, the EU shifted from 3.36% to 3.45% from 2015 to 2025. While that 3.45% figure is a higher number than the 3.29% in the U.S., the percentage gain over the past decade was slower than the U.S. with EU protein growing by just 2.7% compared to 5.8% in the U.S. Meanwhile, both the EU and the U.S. lagged the 4.02% percentage in protein that New Zealand posted in its most recent production season.
What could be thwarting Europe’s growth?
Multiple reasons could be at play for slower milk component growth in the EU. Unlike New Zealand, there isn’t solid data on EU breed composition. On the European continent, Germany accounts for nearly 20% of milk production and roughly 70% of that nation’s cows are Holsteins based on multiple in-country data sources.
When adding France, the Netherlands, Italy, and Poland to the country mix, those nations account for nearly two-thirds of the EU’s output. While Holsteins hold Germanic-like market share in the Netherlands and Italy, Normande and Montbéliarde breeds have major cow populations in France and elsewhere. Likewise, Brown Swiss, Jersey, Ayrshire, and Swedish Red breeds make up significant shares in other EU countries.
Breed diversity is potentially an important factor for the EU’s slow growth in milk components given how genomics has been exponentially reshaping genetics in the U.S. as detailed in the March 2025 CoBank research paper, Unprecedented Genetic Gains are Driving Record Milk Components.
Canadian milk component data endorses this theory. While Canada’s milk pricing is regulated by a stringent milk quota system that limits growth in milk production and dairy product exports, the nation’s milk component trends have been mirroring the U.S. partly because of genetics and partly because Canada’s quota system is based on butterfat.
From 2015 to 2024, butterfat levels in Canada grew from 4.07% to 4.33% and protein levels shifted upward from 3.17% to 3.30%, according to national data from the Government of Canada. Those levels follow the same upward trendline in the U.S., and while the rate of change is slightly below the U.S., the Canadian averages have consistently been slightly higher.
There are multiple reasons for this: Not only do Canadian and U.S. dairy herds have similar feeding practices, the two North American nations largely share the same genetic base. While roughly 80% of the U.S. dairy herd is Holsteins, that breed’s share climbs to 93% in Canada, with Jerseys at 4%. Therefore, the genetic and genomic revolution that is reshaping U.S. milk composition is doing the same in Canada.
While fewer dairy heifers may be genomic tested in Canada, there is no doubt the sire impact has run just as deep. Stateside, using the best genomic tested bulls yields a $100 improvement as measured by Net Merit over the previous year’s heifer crop with a lion’s share of that gain coming from improved butterfat and protein yields. These trends also are taking place in Canada.
Turning back to Europe, data suggests that genomics has played a less sizable role in genetic selection and thus slower growth in milk components. While there could be some debate on the subject in countries with higher Holstein populations like Germany, the Netherlands, and Italy, the debate subsides when it comes to countries with greater variation in breed composition.
Why? Breeds with larger population bases have been experiencing faster-paced genetic progress than those with smaller breed-based populations. This has taken place because data comparisons, not the DNA itself, are the driver for genomic predictions. The larger population base is among the reasons that Holstein cows are leading the pack in growth in milk components in the U.S., as Holsteins more than doubled improvement in butterfat production during the past five years when compared to the other dairy breeds. The same trend holds true for protein.
Too much butterfat?
In the U.S., Multiple Component Pricing has incentivized butterfat and protein production. That, in turn, caused investment in genetics, genomics, and improved feeding strategies. While the U.S. is experiencing meteoric growth in butterfat levels, it may be growing too fast compared to protein. From 2000 to 2014, protein price exceeded butterfat every year and was a factor in rather equal growth between the two leading milk components. However, butterfat pay prices exceeded protein in eight of the past 10 years and that caused a tremendous butterfat boom. The higher pay prices for butterfat have led to record growth in butterfat and that is a concern for cheese production, which now absorbs over half of the U.S. milk supply.
In recent years, butterfat percentages have been increasing at twice the pace of protein. From 2000 to 2017, the U.S. protein-to-fat ratio held rather constant at 0.82 to 0.84. In the ensuing years, the ratio gradually slipped to 0.77. As shown in the graph, this situation isn’t taking place in Europe.
Most cheeses have a higher ratio of protein-to-fat than what naturally occurs in milk. Hence, adding some form of protein solids to milk in a cheese vat is a fairly common strategy to optimize cheese yields. While Mozzarella makers have had to standardize their cheese for years due to the product’s low-fat nature, U.S. Cheddar makers face a greater need to standardize milk either by adding a source of protein like milk protein concentrate or pulling out some butterfat as butterfat percentages have rapidly risen. The alternative is to have greater fat levels in whey, which is a marketable product but nowhere near as valuable as milkfat removed from milk before cheese making.
If Cheddar cheesemakers don’t standardize inbound milk, fat levels may climb too high and cheese quality could decline as higher fat generally yields a softer cheese. As mentioned earlier, standardization is a necessary practice for Mozzarella cheesemakers who either add more protein or remove more cream to meet desirable fat levels in the finished cheese.
Even if dairy farmers pull back on genetic selection for butterfat, the trendline will continue to some extent as butterfat and protein are highly correlated traits. That means gains will continue even when selecting protein over butterfat. Another factor is the fact that protein is mostly improved via genetics.
Meanwhile butterfat’s rapid ascent was enhanced by both genetic selection and feeding strategies. Those feeding strategies could be shifted if the proper price incentives are in place. To that end, cheese yield pricing could give farmers incentives to produce milk with a higher casein-to-fat ratio. Casein is the protein responsible for making cheese. Looking to the future, farmgate milk needs to have a protein-to-fat ratio more in line with how milk is utilized in order to make the entire industry more efficient. That would hold true if the consumer demand for protein remains durable and doesn’t prove to be a fad.
While these strategies warrant full review, it’s interesting to note that Canada’s protein-to-fat ratio has also dropped in recent years. This is taking place in a milk market where farmgate butterfat production is capped based on its milk quota. Given that situation, it would stand to reason that Canadian dairy farmers would try to maximize protein production that has no supply constraints. However, that isn’t happening, which may provide some proof that elevating protein levels isn’t an easy endeavor.
If current growth trends continue for both butterfat and protein, U.S. dairy processors will have additional costs with each passing year to either remove more butterfat or add more protein to make cheese. That ultimately reduces competitiveness on the export front.
Outside of that concern, most signals continue to point upward for milk component demand. That represents an opportunity for dairy farmers to produce more milk components so dairy processors can fulfill demand in both domestic and global markets. In the U.S. the major growth in butterfat and protein levels will be key to filling supply needs for the $10 billion of new dairy plant investment projected to come online through 2027. Advances in research and efficiency are among the reasons that the U.S. dairy industry remains on a strong growth trajectory.
The authors would like to thank external reviewers including Mike Brown, Calvin Covington, Will Loux, Mike McCully, and Andy Novakovic.
Disclaimer: The information provided in this report is not intended to be investment, tax, or legal advice and should not be relied upon by recipients for such purposes. The information contained in this report has been compiled from what CoBank regards as reliable sources. However, CoBank does not make any representation or warranty regarding the content, and disclaims any responsibility for the information, materials, third-party opinions, and data included in this report. In no event will CoBank be liable for any decision made or actions taken by any person or persons relying on the information contained in this report.