
Dash to gas — Why this natural gas build cycle will be slower, costlier and more inflationary for power prices


Key points
- The U.S. gas-fired generation capacity in development has more than tripled over the past two years. The power industry’s hard pivot back to natural gas development looks very different from the merchant-driven boom of the late 1990s or even the post-shale expansion that followed.
- Tighter equipment, infrastructure and delivery constraints are pushing large loads closer to power and fuel infrastructure — while a broader sponsor mix is reshaping competition, plant siting and who ultimately benefits from the new supply.
- The likely result is a more restrained gas buildout that keeps reserve margins tight and electricity costs high for much of the next decade.
- Electric cooperatives can soften some of this impact through diversified procurement, tactical load-management and large-load rate designs that allocate costs more effectively.
As electricity providers scramble to meet surging demand, they are turning to natural gas as a constant, dispatchable power solution. However, the emerging build cycle will not deliver the quick or inexpensive relief of earlier gas booms. Data center growth, industrial expansion, coal retirements and reliability concerns are creating urgent demand for firm capacity, that is, reliable power supply when demand is high. And it’s hitting just as turbines, transformers, interconnection access and fuel infrastructure are becoming harder and costlier to secure. The result is a gas buildout that is likely to be slower, more selective and more inflationary than headline project pipelines suggest. That has important implications for electric cooperatives managing procurement, load growth and member affordability.
The U.S. generation development pipeline still reflects the recent solar boom, but that mix is mostly the result of earlier policy-driven investment decisions. It may also mask how quickly developers are shifting back toward natural gas, especially given the pace at which solar projects are being canceled.
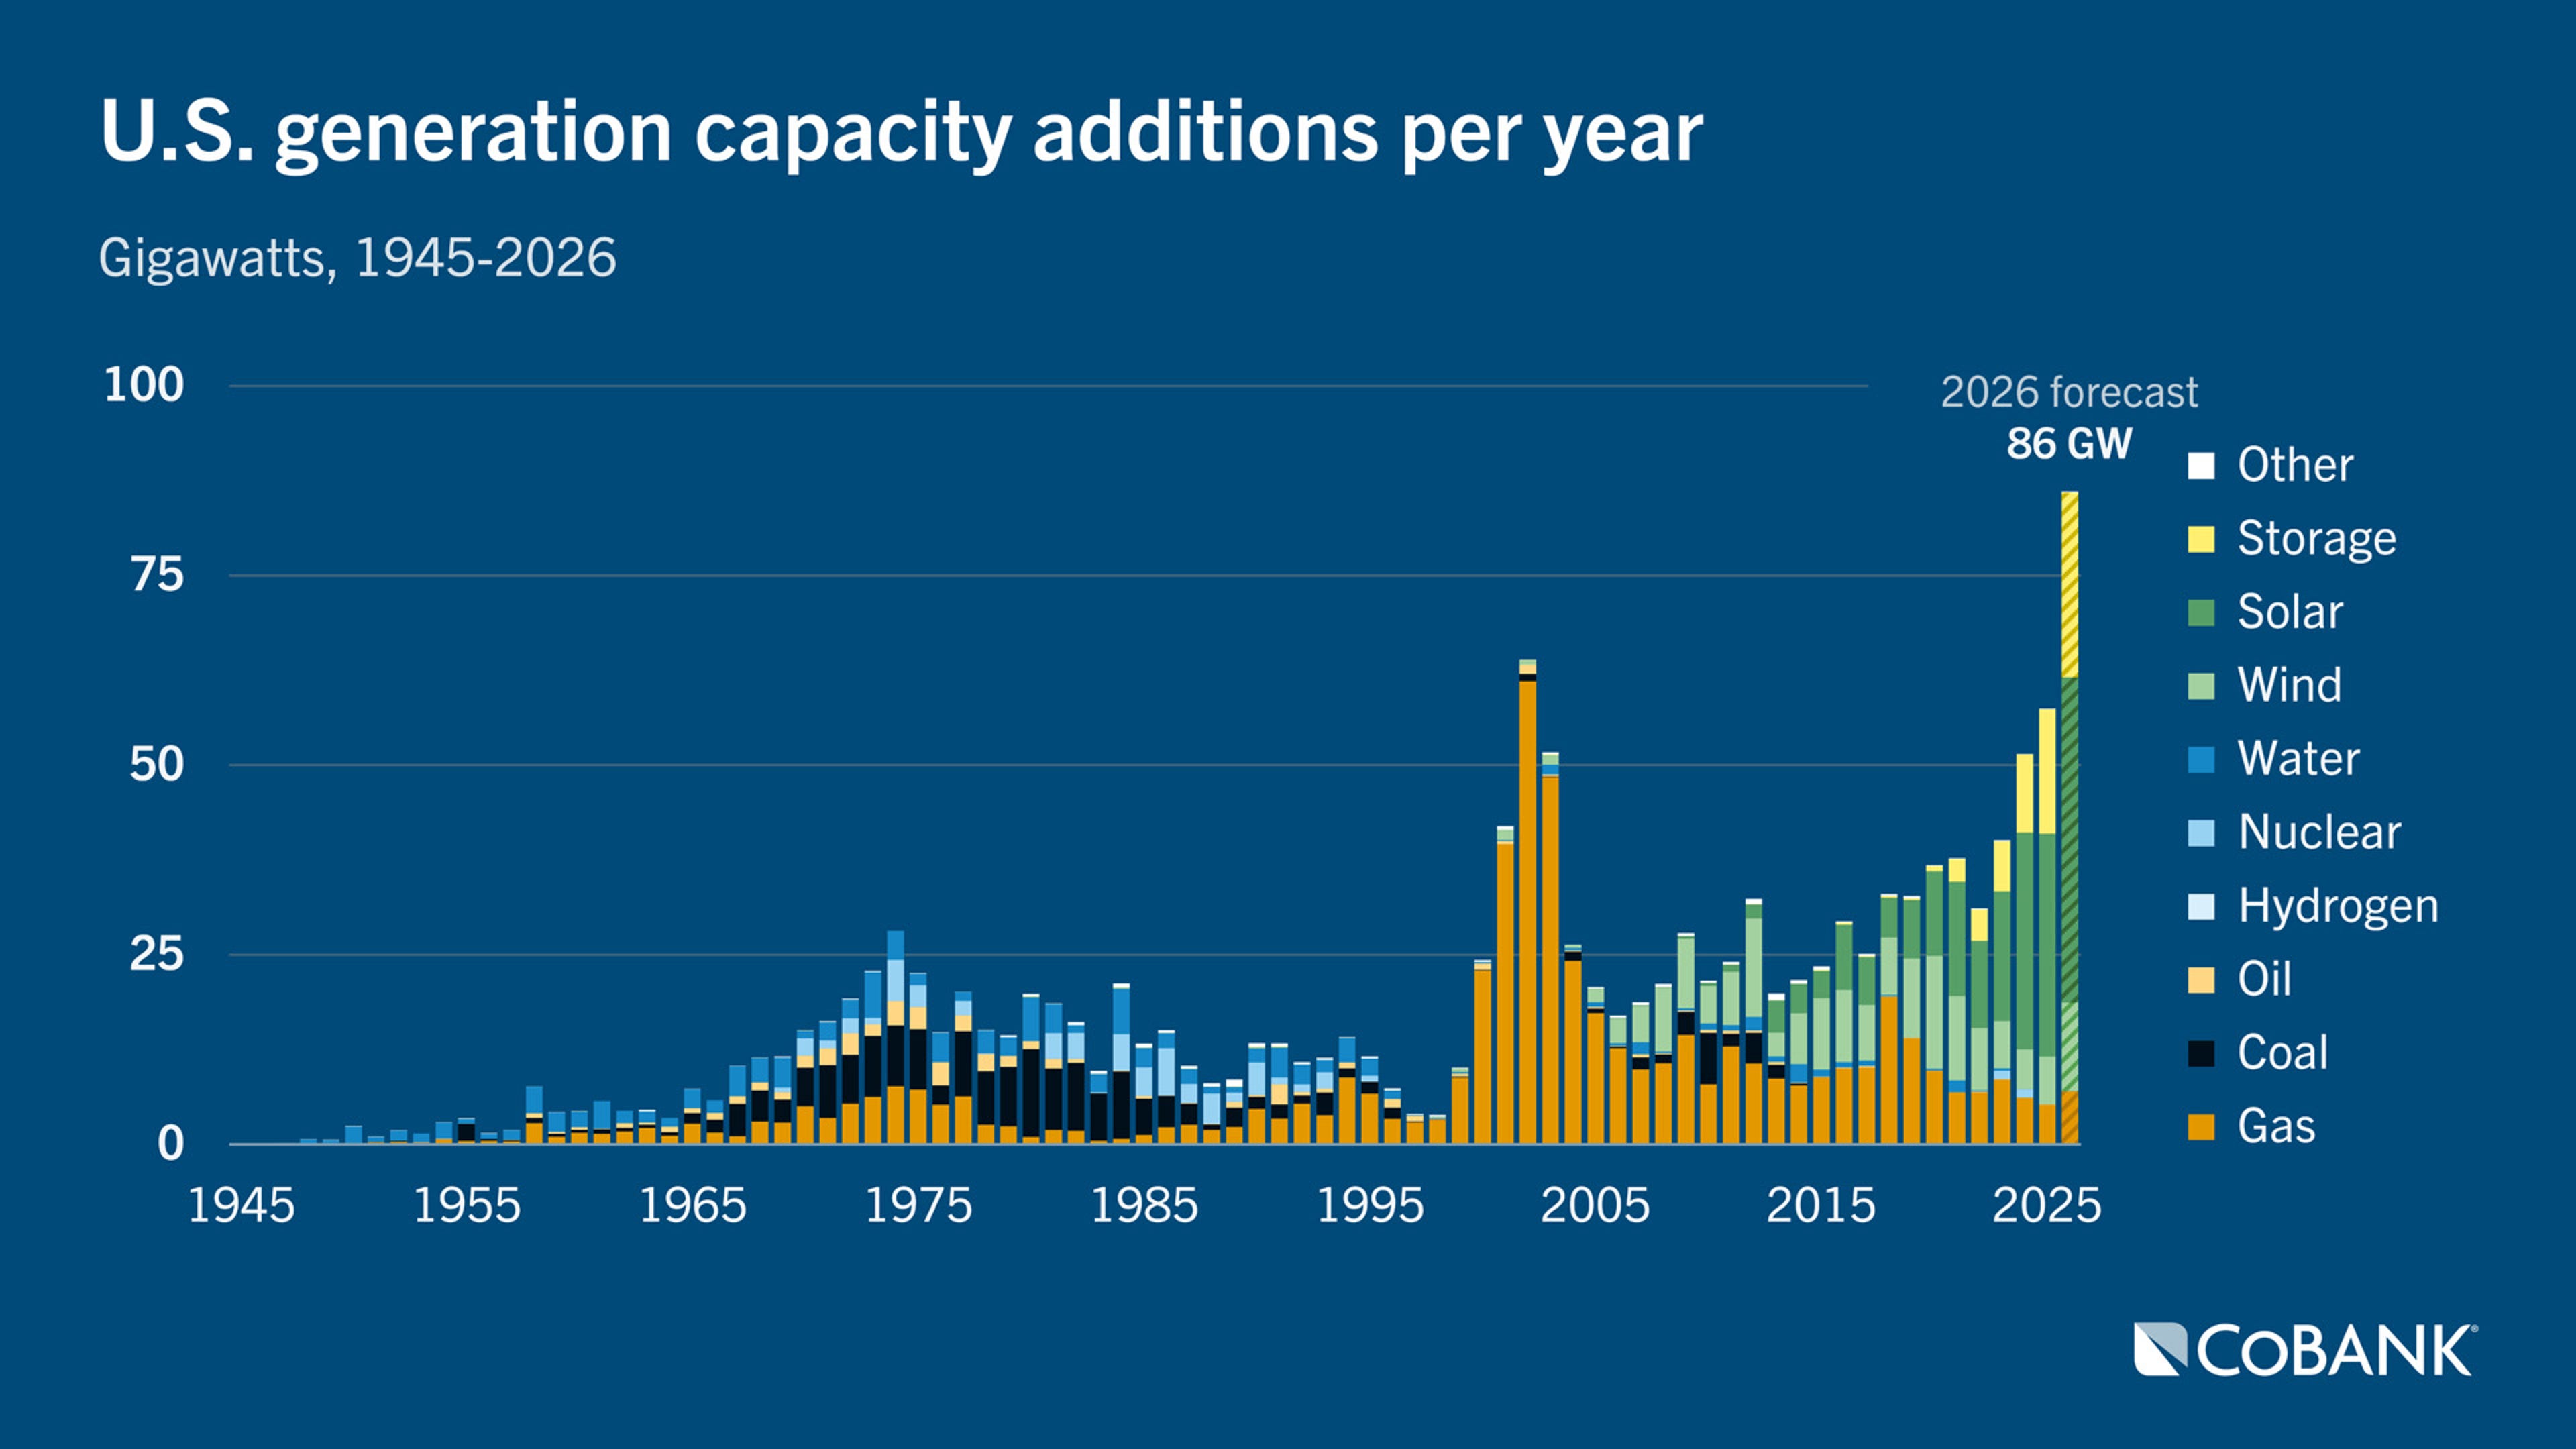
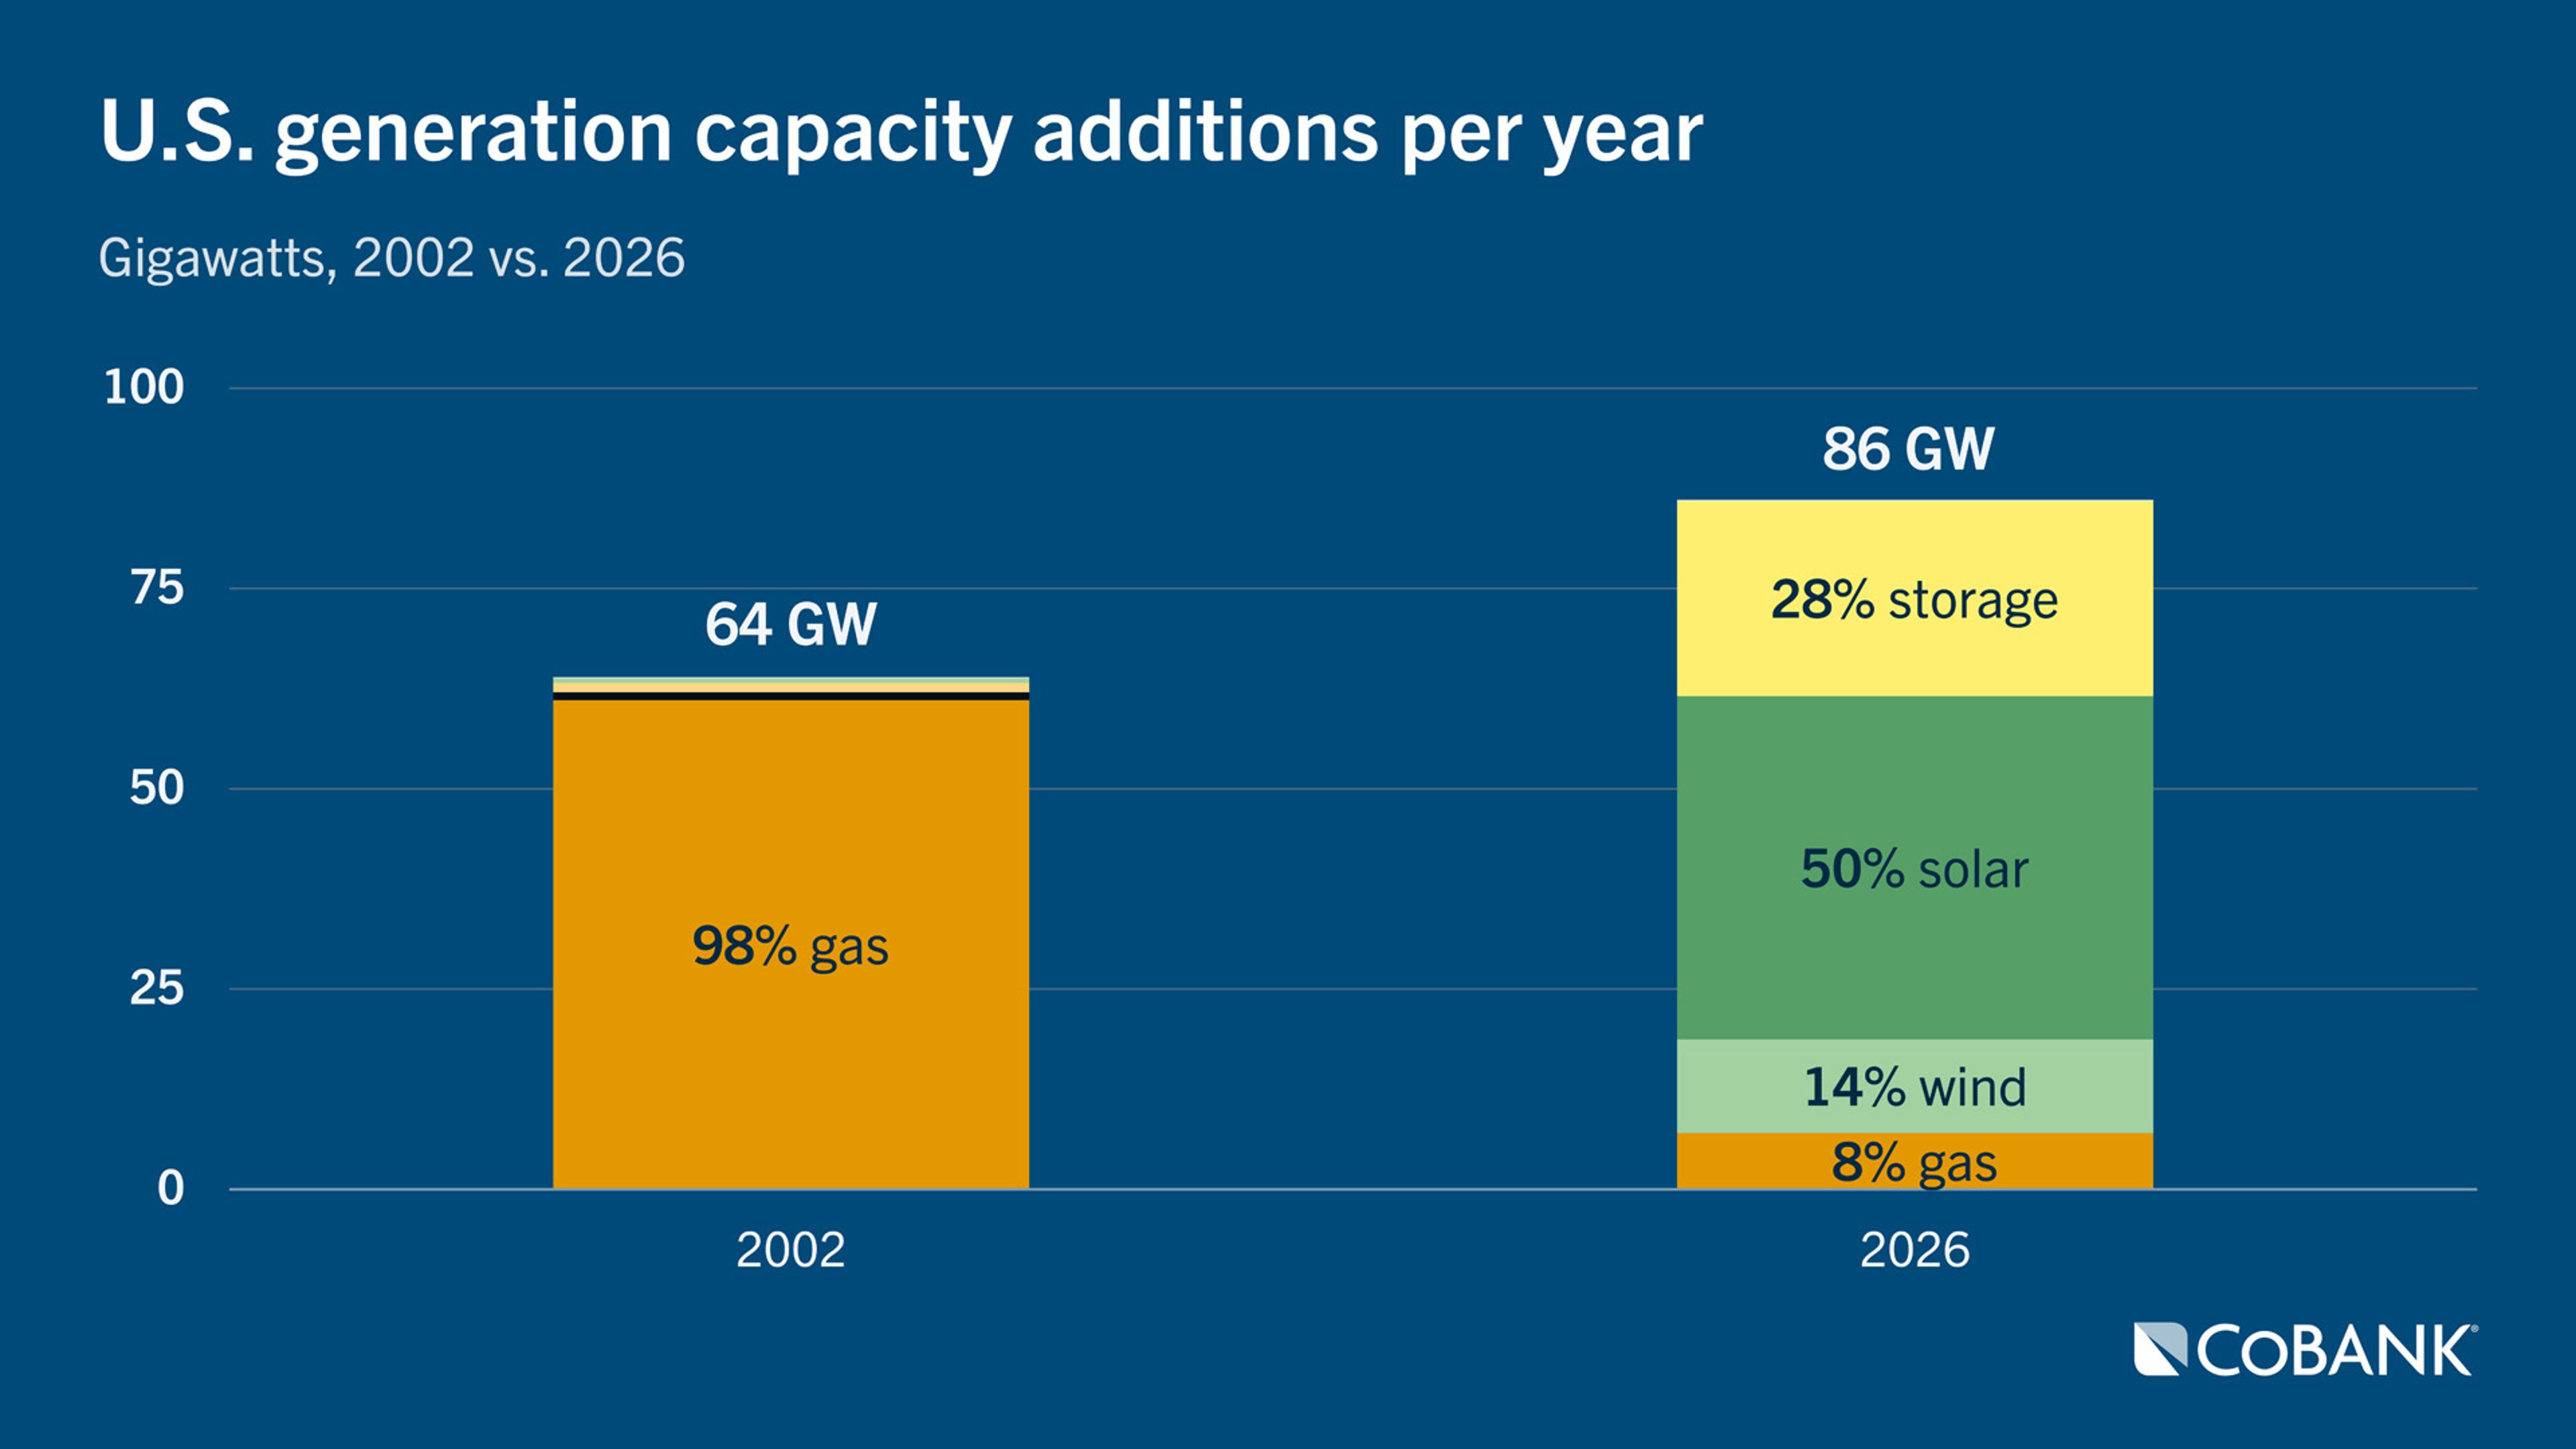
A record 86 gigawatts of new utility-scale U.S. capacity will be built in 2026, with solar accounting for 50% (43 GW), battery storage 28% (24 GW), wind 14% (12 GW) and natural gas just 8% (7 GW). The industry’s previous annual buildout record was in 2002, when the natural gas construction boom accounted for 98% of additions and brought 64 GW of new supply to the grid.
The recent development “heliocentrism” is also visible in dispatch, with solar becoming the nation’s third-largest electricity source in May (after surpassing coal-fired generation in March), and renewables collectively generating more power than gas for the first time in the U.S. history. Still, the shifting generation mix has increased reliability pressures as the growing ‘round-the-clock demand from data centers outpaces the buildout of baseload generation, setting the stage for a very different development cycle ahead.
At this year’s Atlantic Council Global Energy Forum, U.S. Energy Secretary Chris Wright described natural gas as the nation’s “energy superpower” and a critical resource for expanding electricity supply quickly. Wright’s perspective is increasingly reflected in utility and developer behavior, as natural gas regains traction as the “safe bet” resource of dispatchable capacity to support reliability and serve rapidly growing data center demand. Indeed, U.S. gas-fired generation capacity in development has more than tripled over the past two years, driven largely by the power needs of artificial intelligence infrastructure and a broader revival in industrial activity.
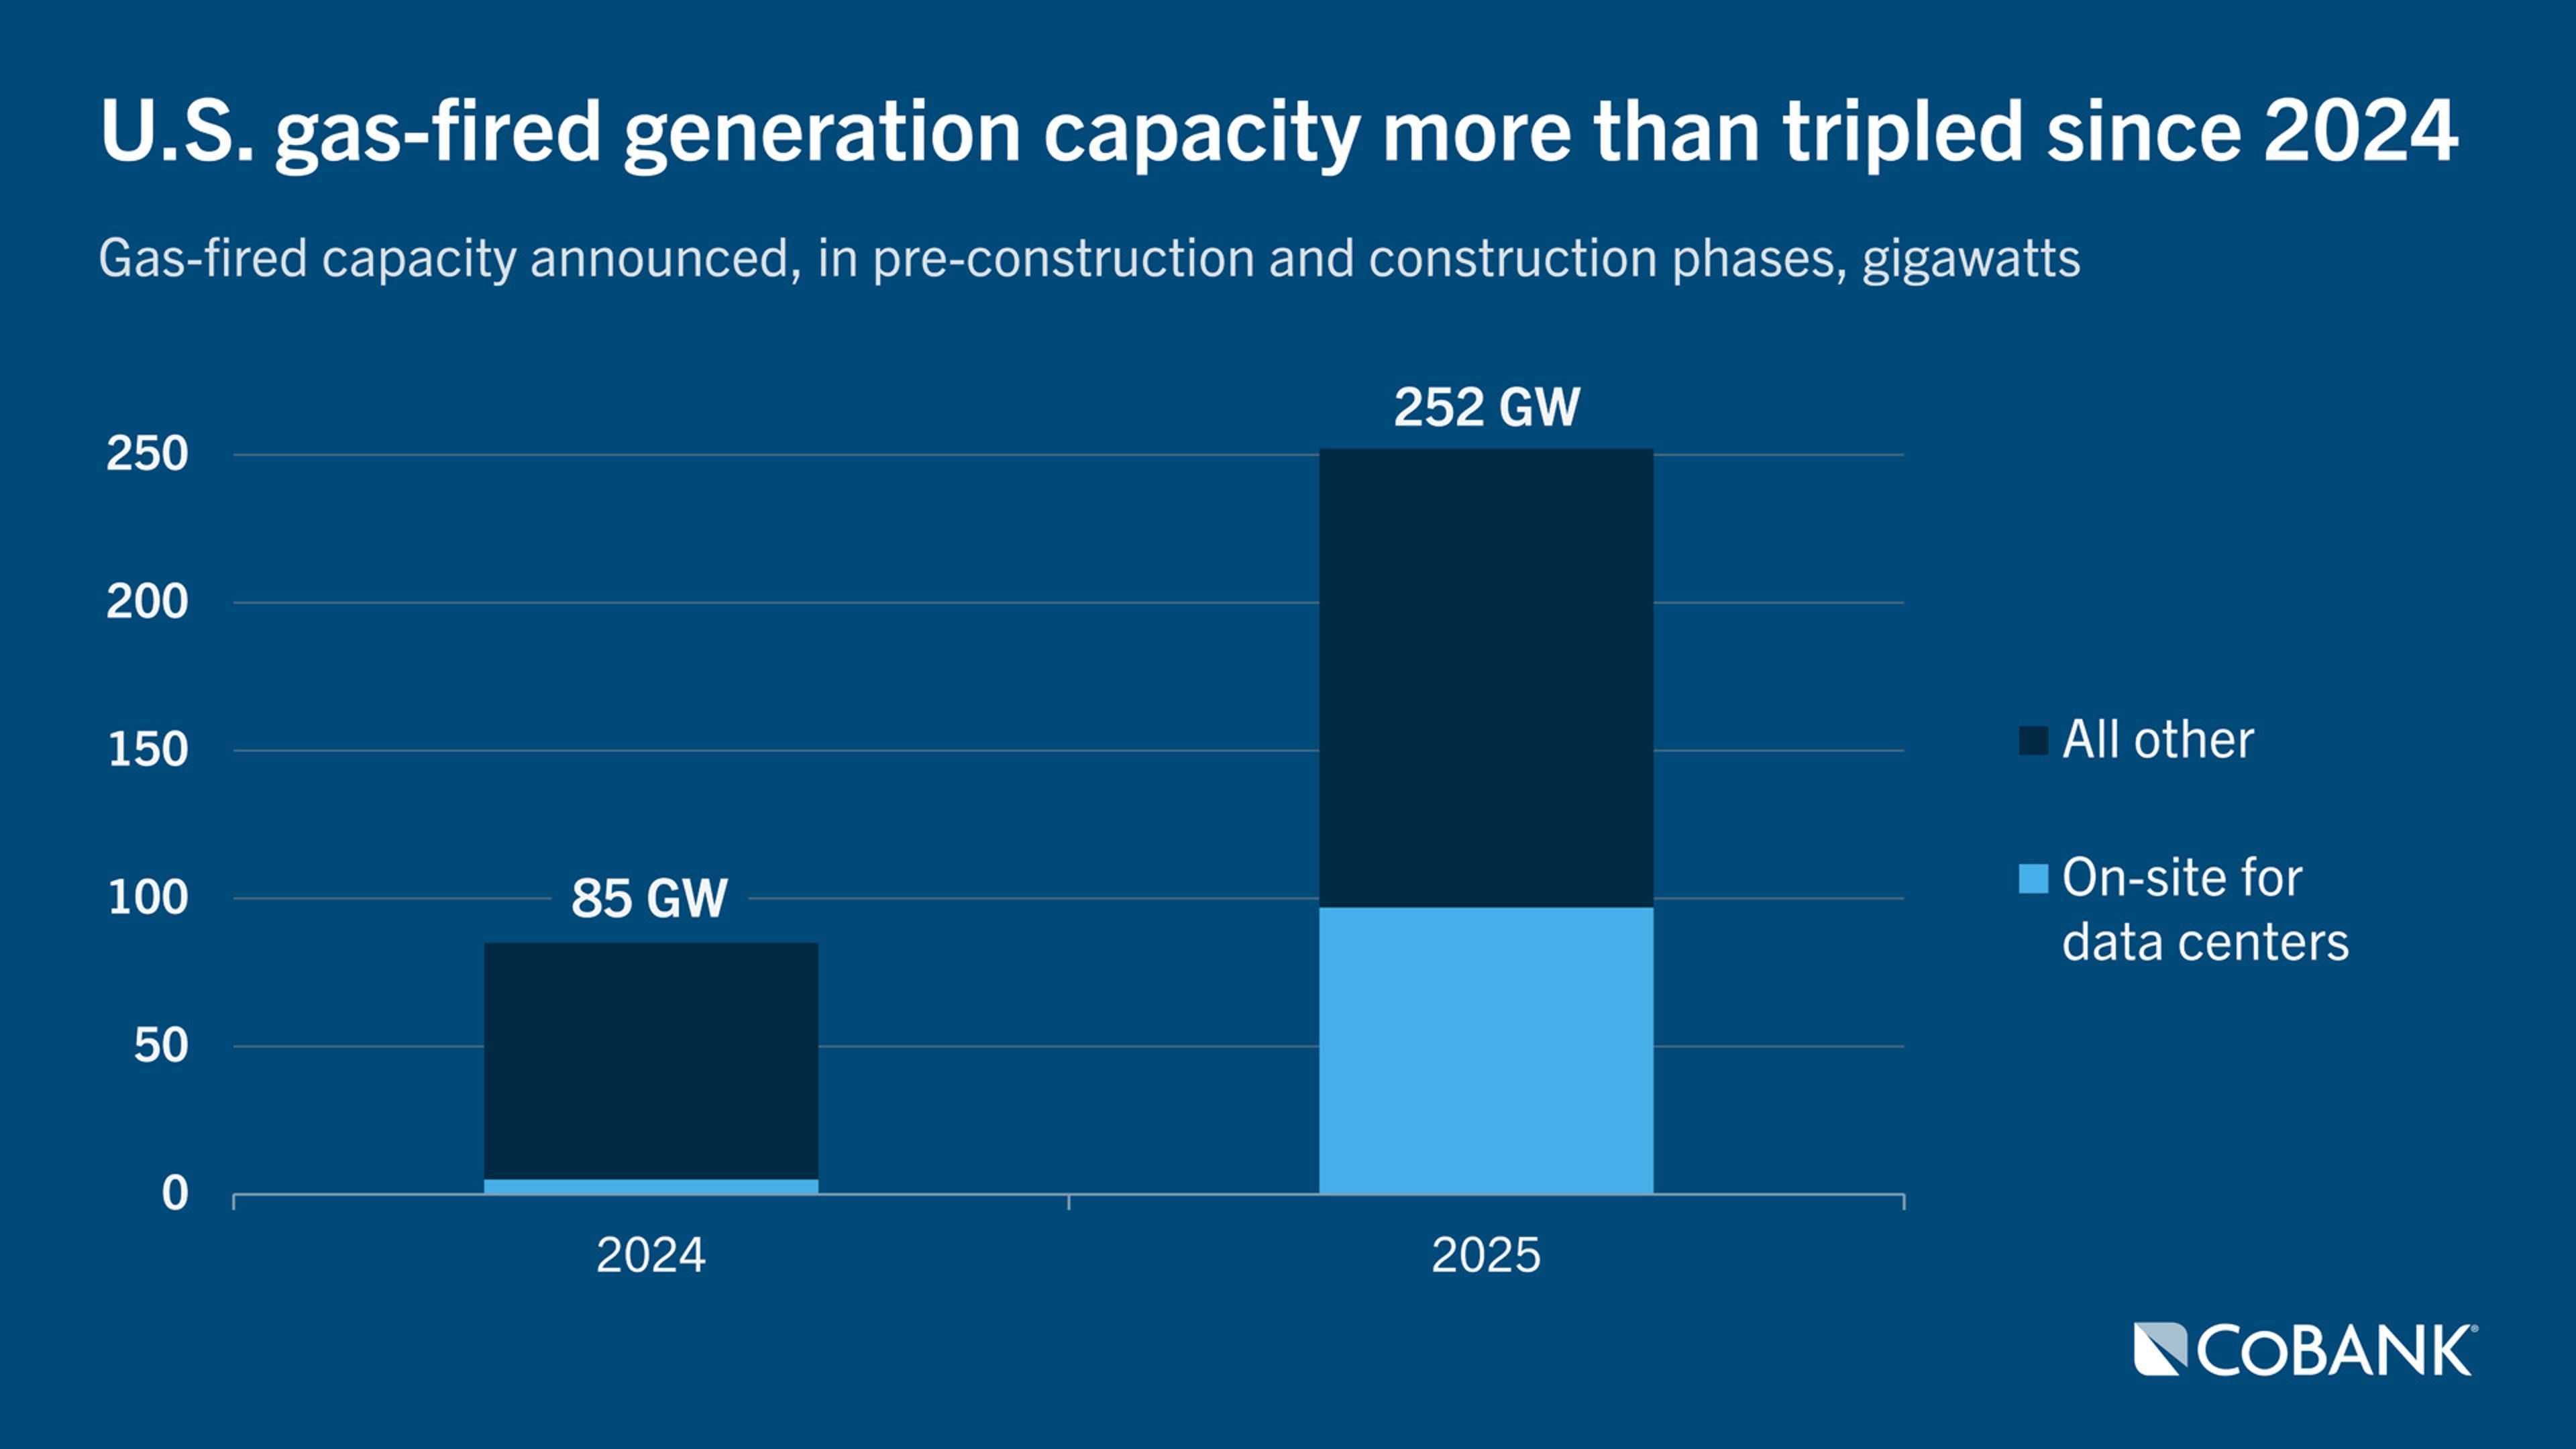
EIA Form 860 filings offer a conservative public baseline for planned power plant additions, but even these data clearly show a turbo-charged shift back toward natural gas. The agency’s late May 2026 release identified 68 GW of planned gas-fired additions, up from 19 GW in their May 2024 release. Broader project trackers, capturing earlier-stage development, project a much larger pipeline of roughly 252 GW. Should all those projects become operational, the existing gas-fired generation would expand by nearly 50% from its current 572 GW base.
The revival in gas capacity development reflects a clear shift in planning priorities toward firm, scalable generation. But renewed enthusiasm for natural gas should not be mistaken for ease of execution.
This new build cycle is unfolding in a much tighter physical and financial environment, ultimately slowing the pace at which new gas capacity can reasonably move from announcement to operation. The ownership for natural gas-fired generating plants is also widening beyond traditional utilities and independent power producers to include private developers backed by tech hyperscalers and large industrial firms. Changing ownership patterns will ultimately influence where these plants are located, how materials and fuel are sourced and who benefits. Putting this aside, the gas-heavy strategy now unfolding adds risk by intensifying competition for scarce turbine supply and deepening the power sector’s reliance on a single fuel.
The gap between announced projects and those in construction make it evident that achieving plant commissioning will be an uphill battle, with Global Energy Monitor data estimating that two-thirds of projects in development do not have a named turbine manufacturer. And because much of the new capacity is aimed at large-load growth rather than replacement or system-wide needs, it remains unclear who will ultimately bear the costs of this development cycle. These emerging frictions matter because the foreseeable delays required to settle these issues will slow new baseload additions, tighten reserve margins and keep electricity prices elevated for longer.
Even so, electric cooperatives can mitigate some of these pricing pressures through diverse procurement strategies, targeted load management and rate design that more effectively assigns costs to the customers driving them.
This time it’s different: 3 distinct gas development eras
The current wave of gas development is best understood in the context of two earlier new-build cycles, each shaped by a different set of market conditions. The first, from roughly 1999 to 2005, was a merchant-driven expansion in a far more permissive development environment. The second, from about 2006 to 2018, was powered by the shale boom which improved gas-fired generation economics and supported utility-led development without today’s load-driven urgency. The emerging third era, from 2027 to 2035, is being driven by large-load growth, baseload retirements and rising reliability concerns in a much more constrained setting with a broader slate of players. The key comparison, therefore, is not simply the volume of gas capacity developers hope to build, but how the conditions underlying each era differ — and why those differences will limit what gas-fired capacity can quickly and realistically be added to the grid.
The merchant deregulation cycle: 1999-2005
From 1999 to 2005, the U.S. experienced a merchant-led gas build push in a far more expansionary development environment. Annual gas-fired additions rose from roughly 9 GW in 1999 to a peak of 61 GW in 2002, before falling back to about 17 GW by 2005, averaging roughly 32 GWs of development each year. The pace of development far exceeded that of proceeding (or successive) cycles of supply growth and ultimately contributed to overbuilding. As a result, the market entered a period of surplus capacity, with many combined-cycle plants initially underutilized, operating at an average capacity factor of just 34% by 2003.
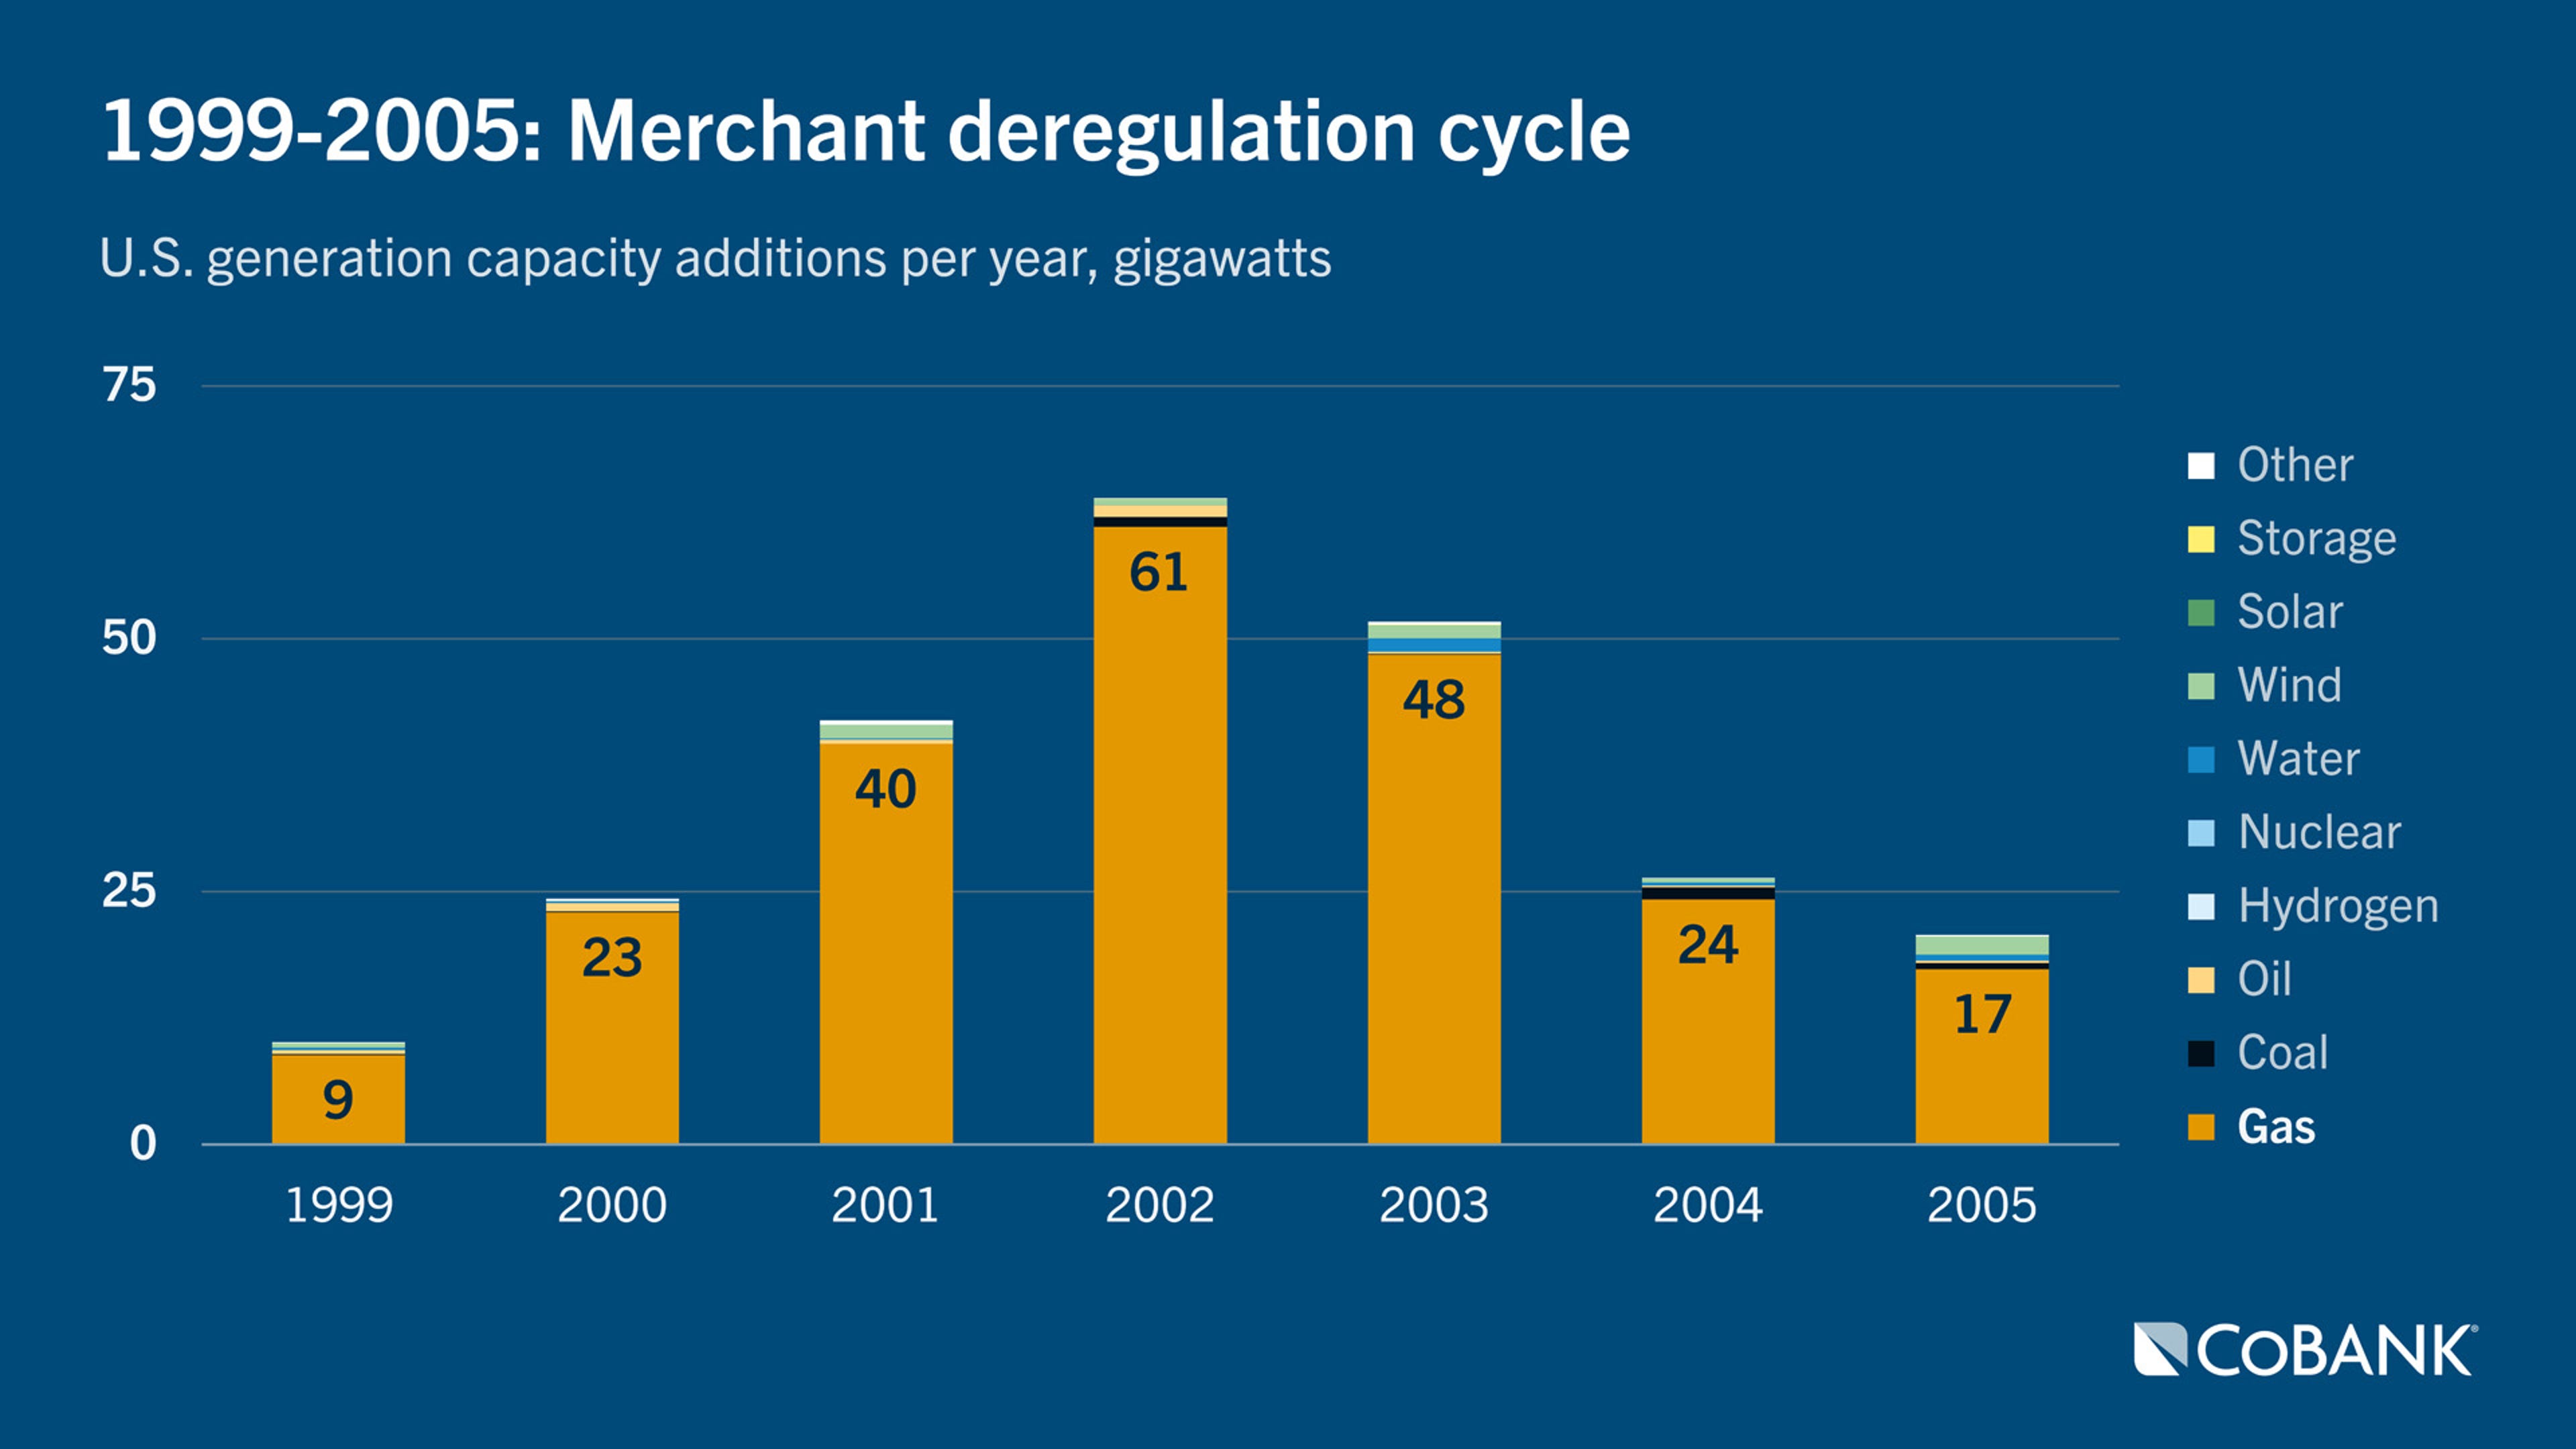
This build cycle was defined by easier access to turbines and balance-of-plant equipment, a more permissive pipeline expansion environment, and capital markets willing to finance merchant generation on the expectation that deregulation and wholesale competition would continue to expand. The emerging Regional Transmission Organization (RTO) framework also helped usher in this era by creating centralized market platforms for newly connected interstate power networks. The main question posed by developers was whether a project made economic sense, not whether developers could obtain the equipment, grid access and fuel infrastructure needed to build it. What merchant developers misjudged was the durability of power prices and capacity values in a market marked by weak electricity growth and an increasingly crowded field of independent producers.
Rampant overestimation of returns left the market far more cautious in ensuing years. By the early 2000s, merchant and independent power producers were sponsoring much of the new gas-fired development, while utilities played a smaller role. When the market tipped into overbuild, weak spark spreads, low-capacity factors and depressed wholesale prices proved financially ruinous for many of those earlier merchant developers, forcing restructurings, asset sales and, in some cases, bankruptcy. That experience helped shift the next gas cycle away from speculative deregulation upside and toward a more disciplined, utility-led model built around fuel-cost advantages in a weaker demand environment.
The powered-by-shale cycle: 2006-2018
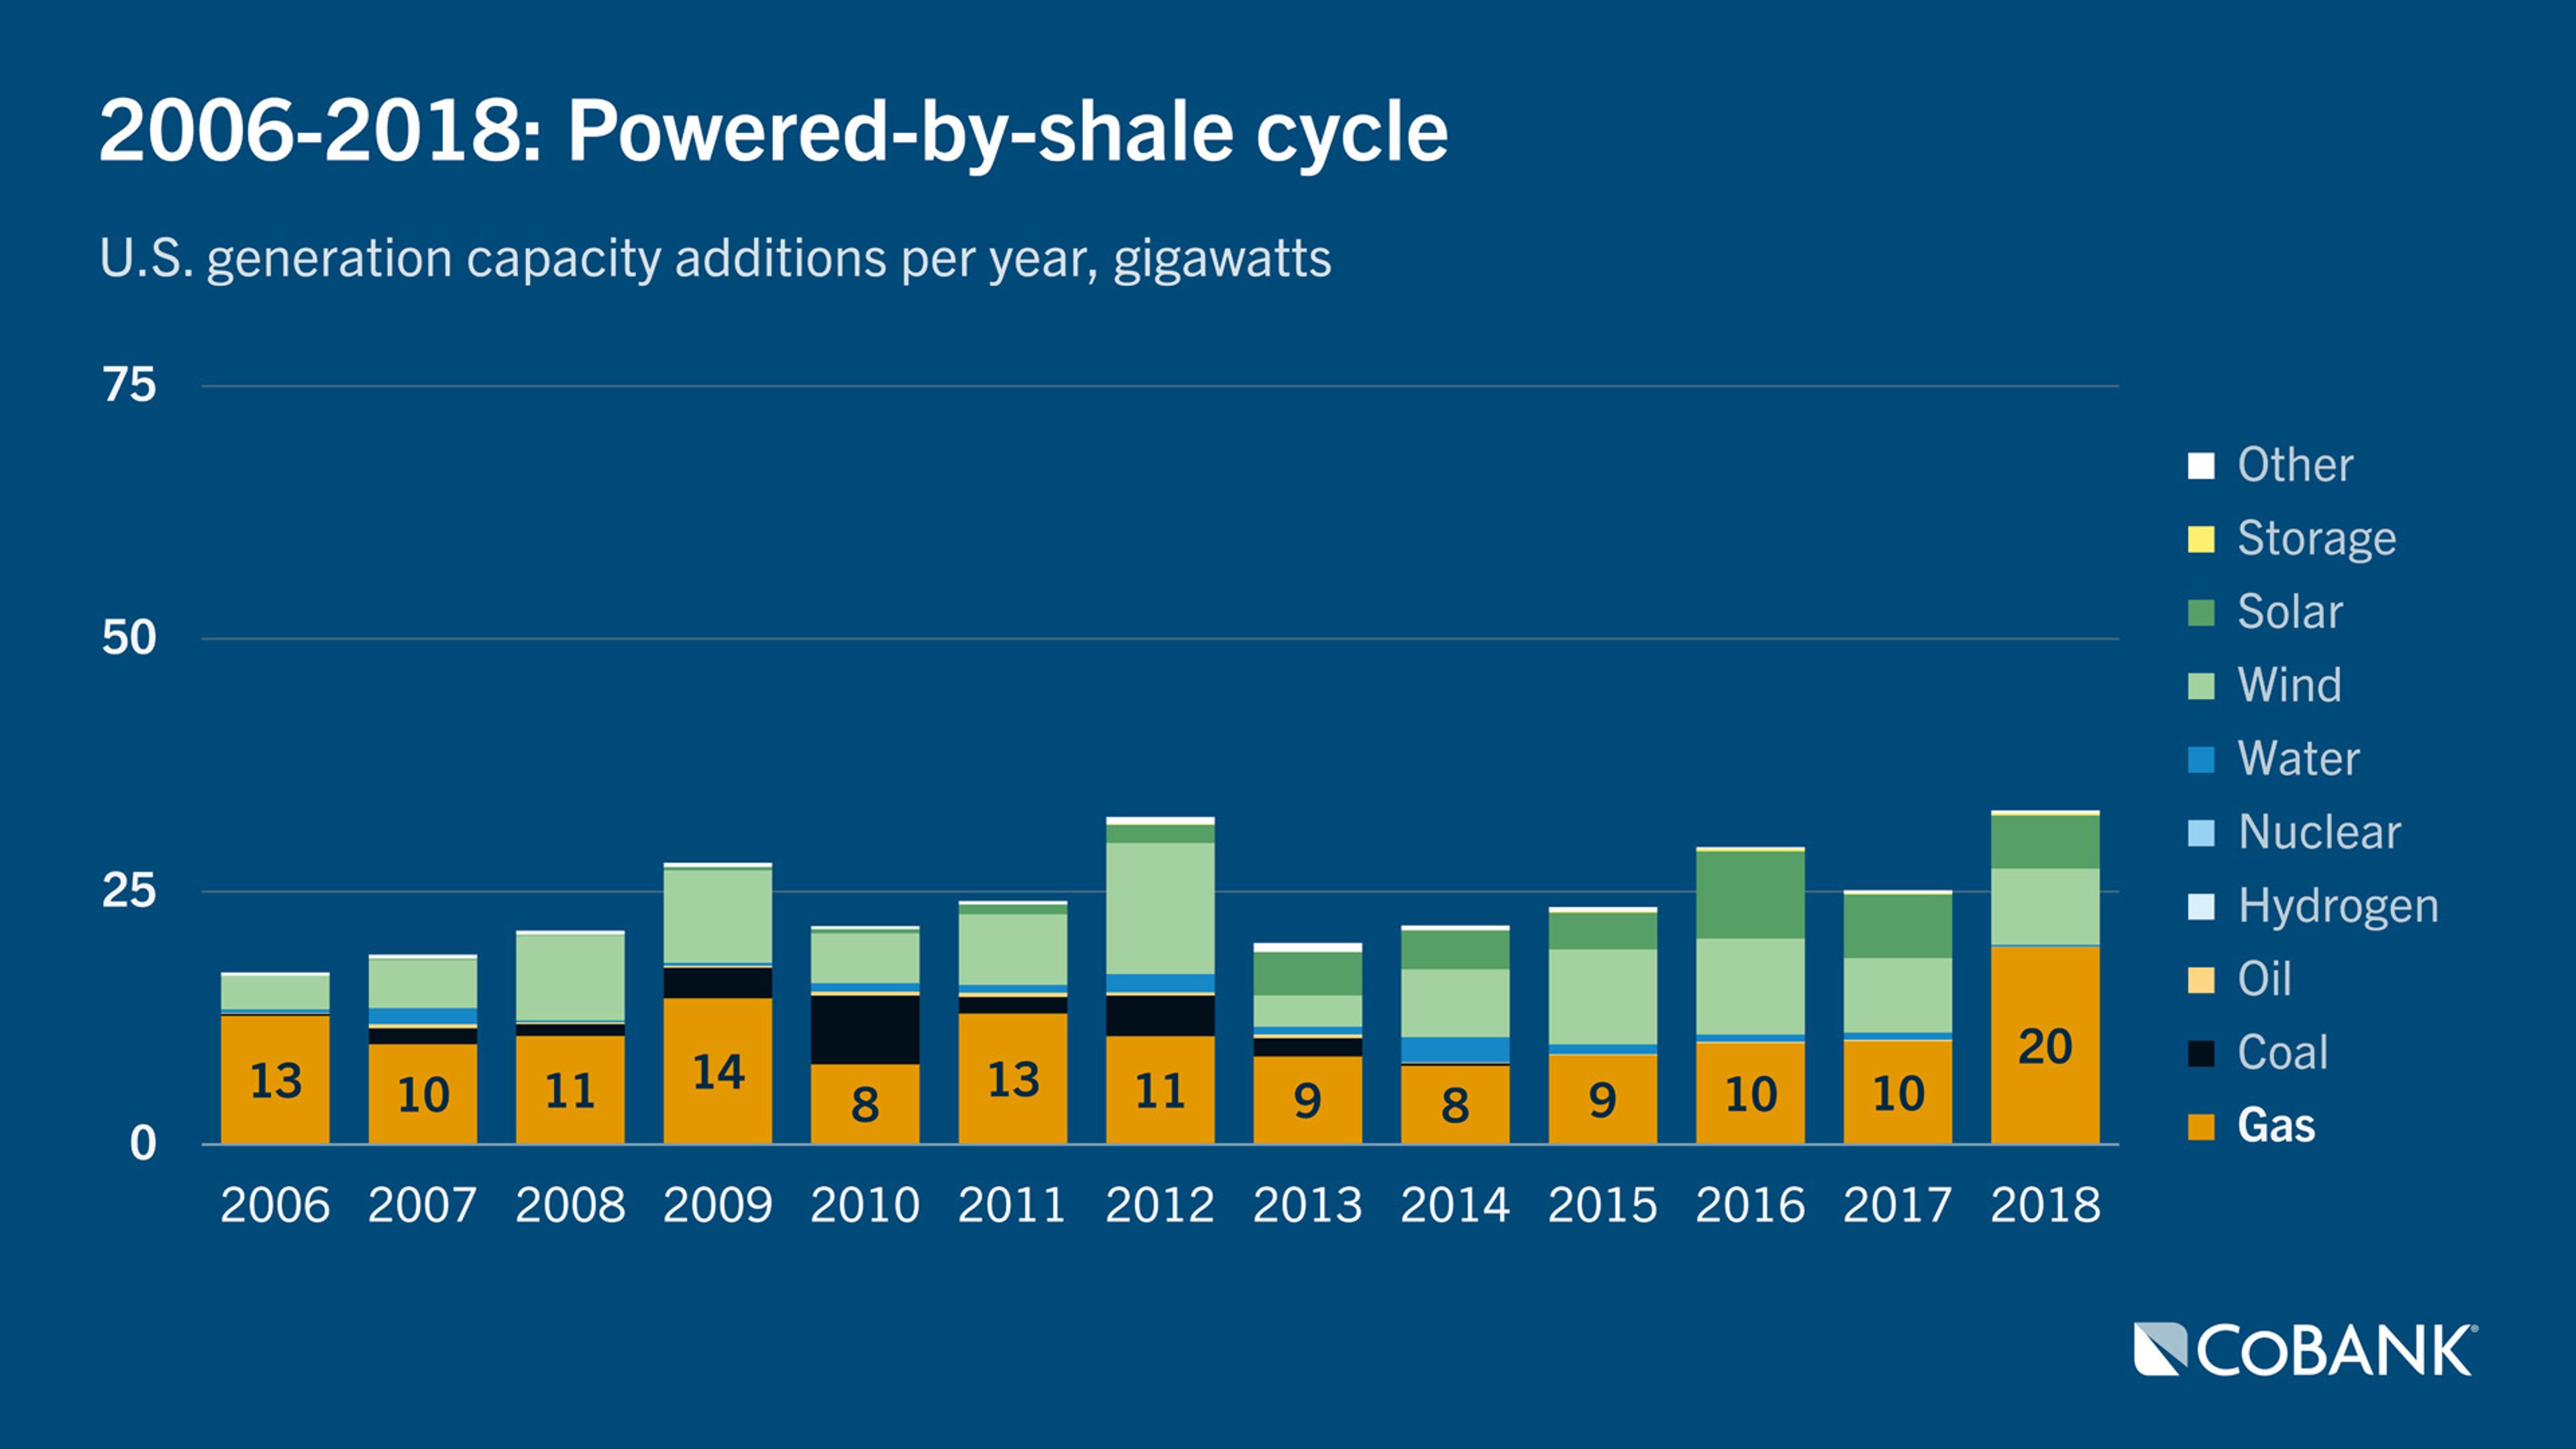
From 2006 to 2018, U.S. natural gas additions averaged about 10 GW per year, ranging from 8 GW to 19.5 GW. Compared with the merchant boom, this was a more measured, utility-led cycle that added only about one-third as much annual capacity. While the earlier boom was driven by independent power producers making speculative bets in newly deregulated wholesale markets, the shale-era buildout was led largely by regulated utilities relying on rate-based cost recovery to add capacity more steadily. It also reflected a much different fuel outlook, as abundant, low-cost domestic shale gas lowered fuel-cost expectations, improved gas-fired generation economics and made natural gas attractive across much of the country.
Without a doubt, this period of natural gas power plant development benefited greatly from the surge in shale gas production and massive expansion of interstate pipeline infrastructure. In 2006 — the dawn of the shale boom — shale formations supplied only about 2 billion cubic feet per day (Bcf/d), or 5% of U.S. natural gas production. By 2018, shale output had surged to roughly 65 Bcf/d, representing about 70% of domestic supply. That production growth helped drive a historic expansion of the U.S. pipeline network, with more than 110 Bcf/d of interstate capacity added from 2006 to 2018, including over 44 Bcf/d in 2008 alone.
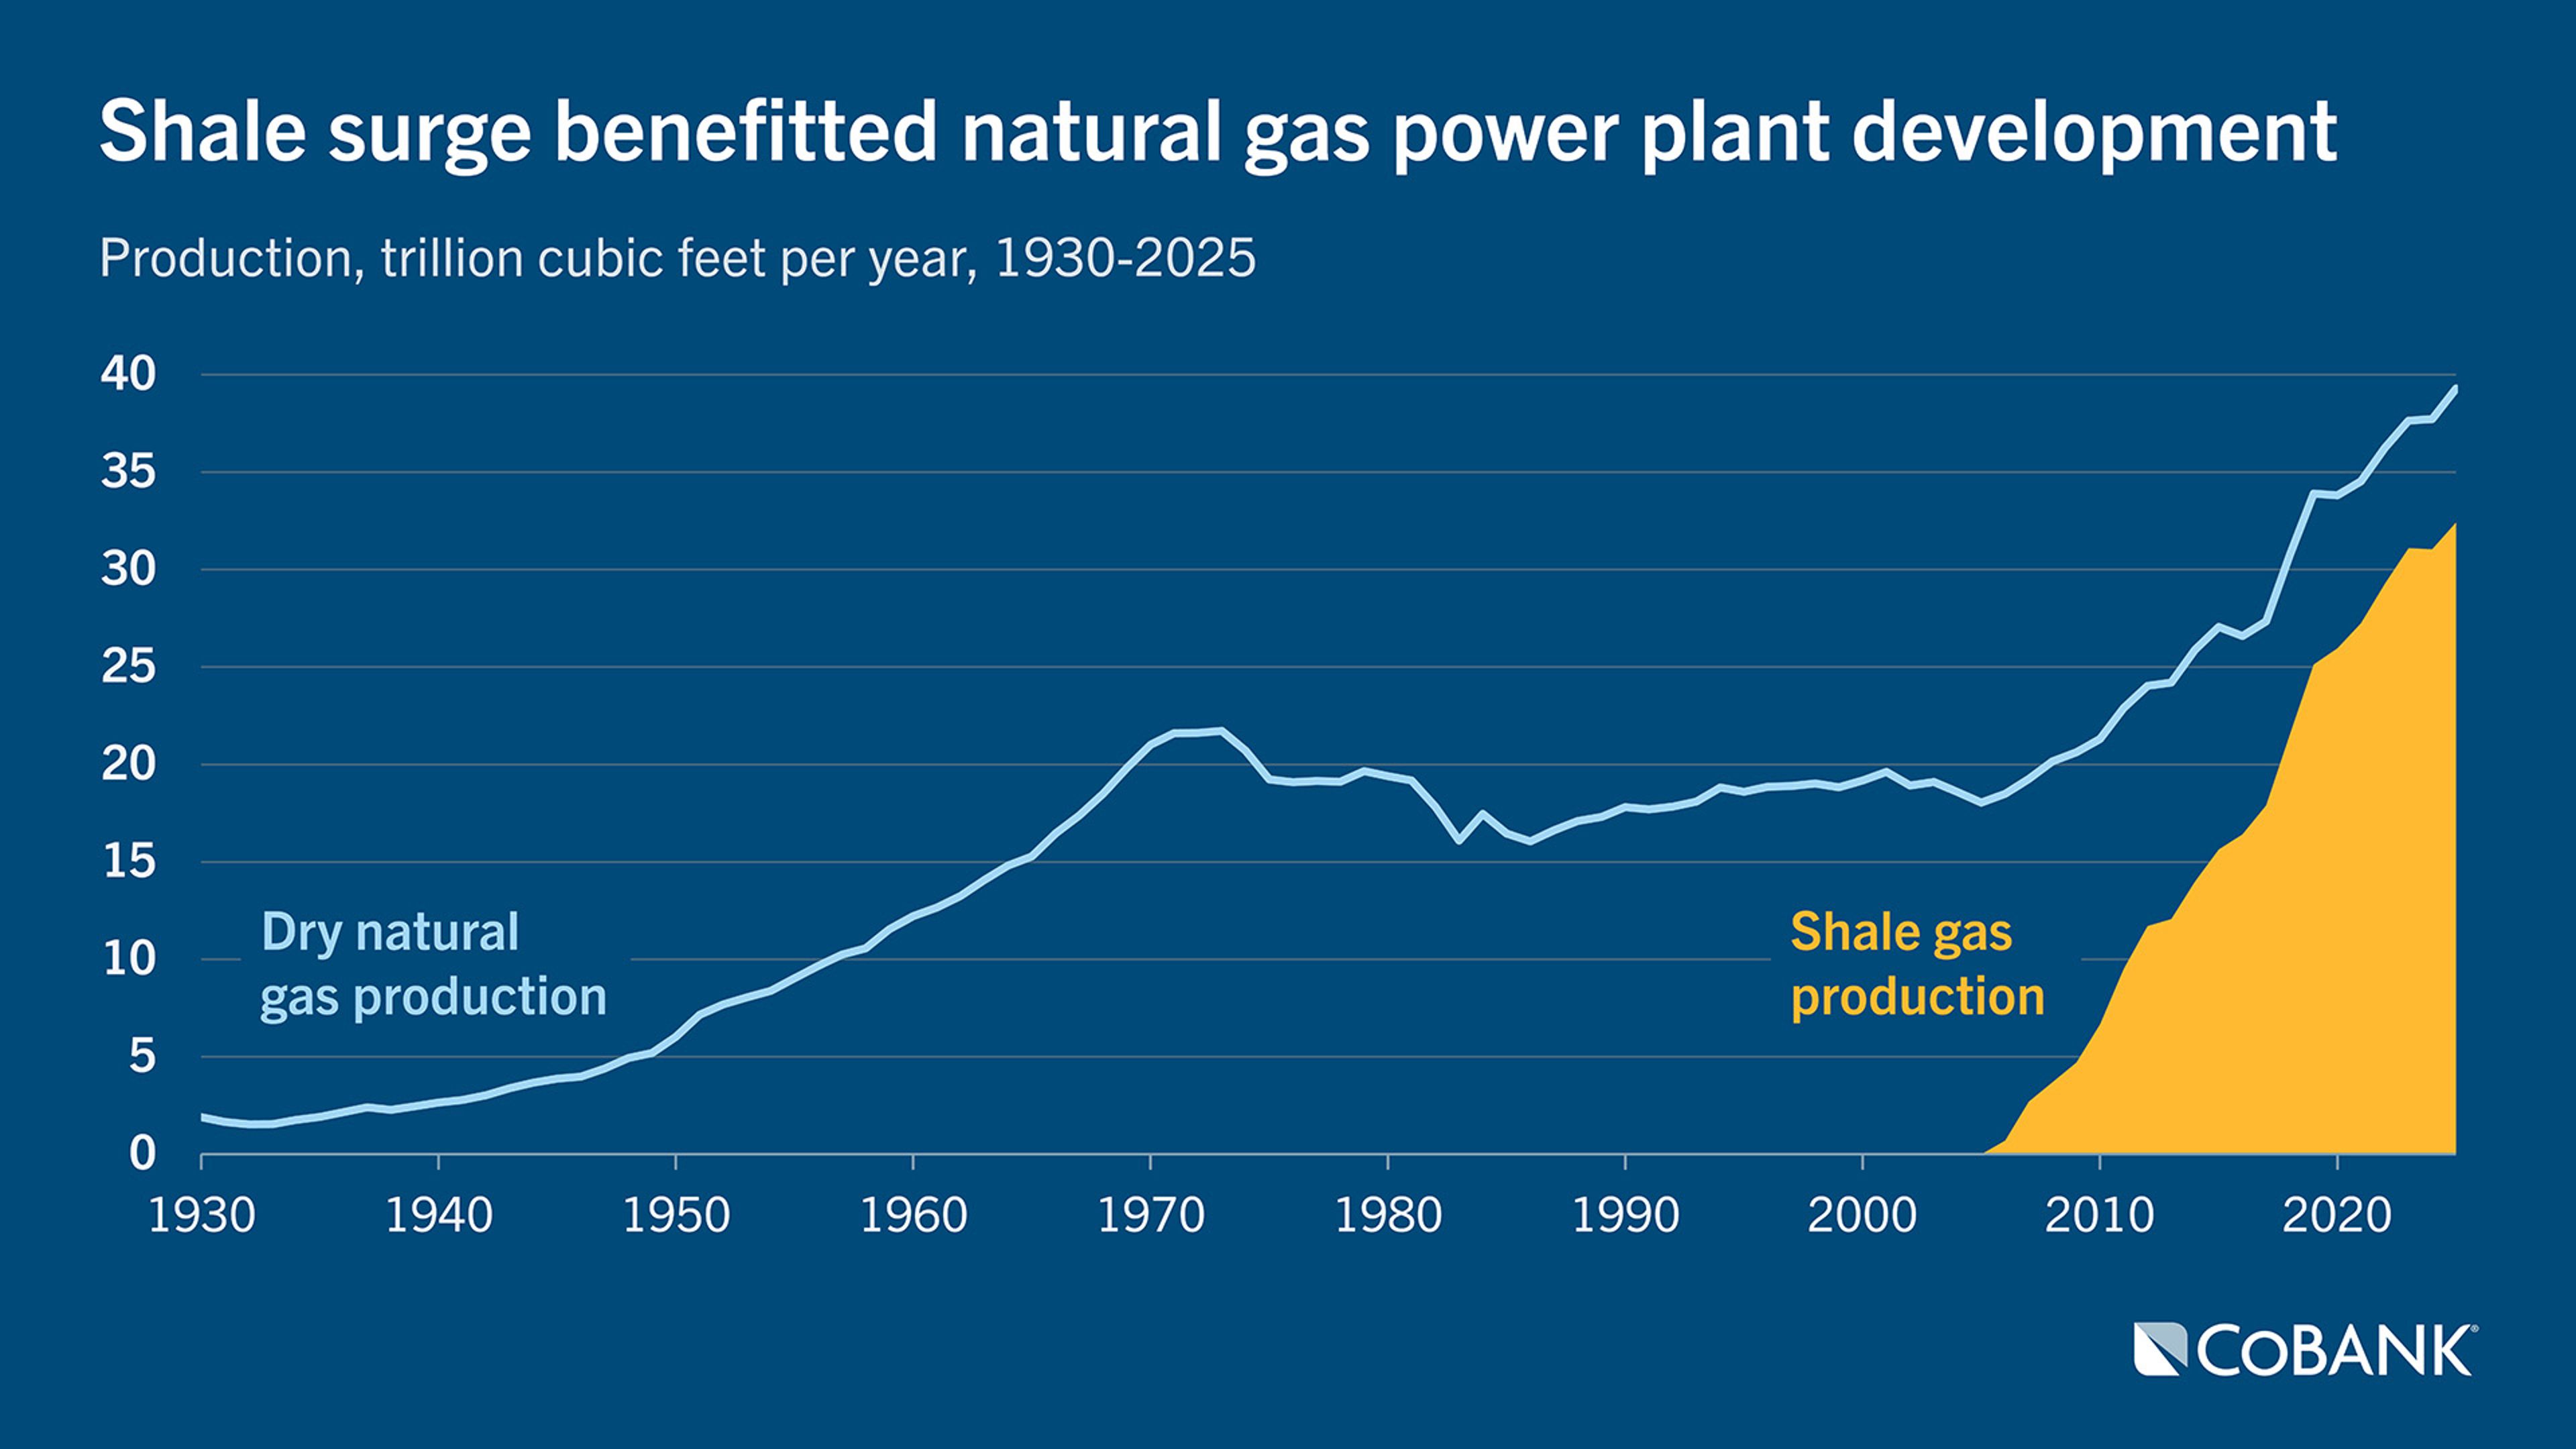
But the shale-era midstream bonanza did more than add pipe capacity; it reoriented North American gas flows by opening constrained basins such as the Marcellus and Utica. Unlike the merchant boom, which relied mainly on established routes moving Gulf Coast and Canadian gas to regional power plants, the shale cycle linked low-cost domestic supply with utilities that were replacing aging coal fleets with gas-fired generation. But it also offered another cautionary tale for energy investment as speculative capital that once fueled the uncontracted merchant power bust shifted into shale, driving a decade-long “production at all costs” boom. By 2018, investor patience began wearing thin as public markets realized that despite turning the U.S. into an energy superpower, the “production at all costs” approach often destroyed shareholder value. The sector suffered an historic level of credit defaults by 2020.
Power plant development in this era followed different incentives than the merchant boom. From 2006 to 2018, roughly 70% to 80% of new capacity was backed by regulated utilities or long-term power purchase agreements (PPAs). After the early-2000s merchant bust, capital markets largely avoided projects without committed buyers, making the shale era a more risk-averse, contract-backed cycle. Utilities were primarily replacing aging coal plants as tighter environmental rules made costly retrofits less appealing. Although this buildout was more disciplined and supported by low-cost fuel, it unfolded in a less constrained environment because it was not driven by rapid load growth. Cheap natural gas, efficient combined-cycle technology and higher capacity factors improved plant economics, allowing gas to displace coal as the nation’s primary baseload resource. By the end of the period, however, the same cost deflation that strengthened gas economics was also accelerating renewable development, setting the stage for the 2019 to 2026 regime shift toward solar.
The speed-to-power cycle: 2027-2035
The next gas build cycle, likely unfolding from 2027 to 2035, is increasingly being coined the speed-to-power cycle — a demand-driven pull to bring firm capacity online as quickly as possible amid data center growth, manufacturing expansion, coal retirements and reliability concerns. This consumer-led cycle is less about falling fuel costs and more about quick, reliable supply. But it is defined by a constrained equipment supply, slower interconnection and fuel infrastructure, a more crowded sponsor mix, and higher interest rates that raise the cost of carrying development risk. The result is a widening split between price-insensitive large loads and highly price-sensitive residential and small commercial customers — a divide that is likely to trigger a strong, and at times heavy-handed, policy response.
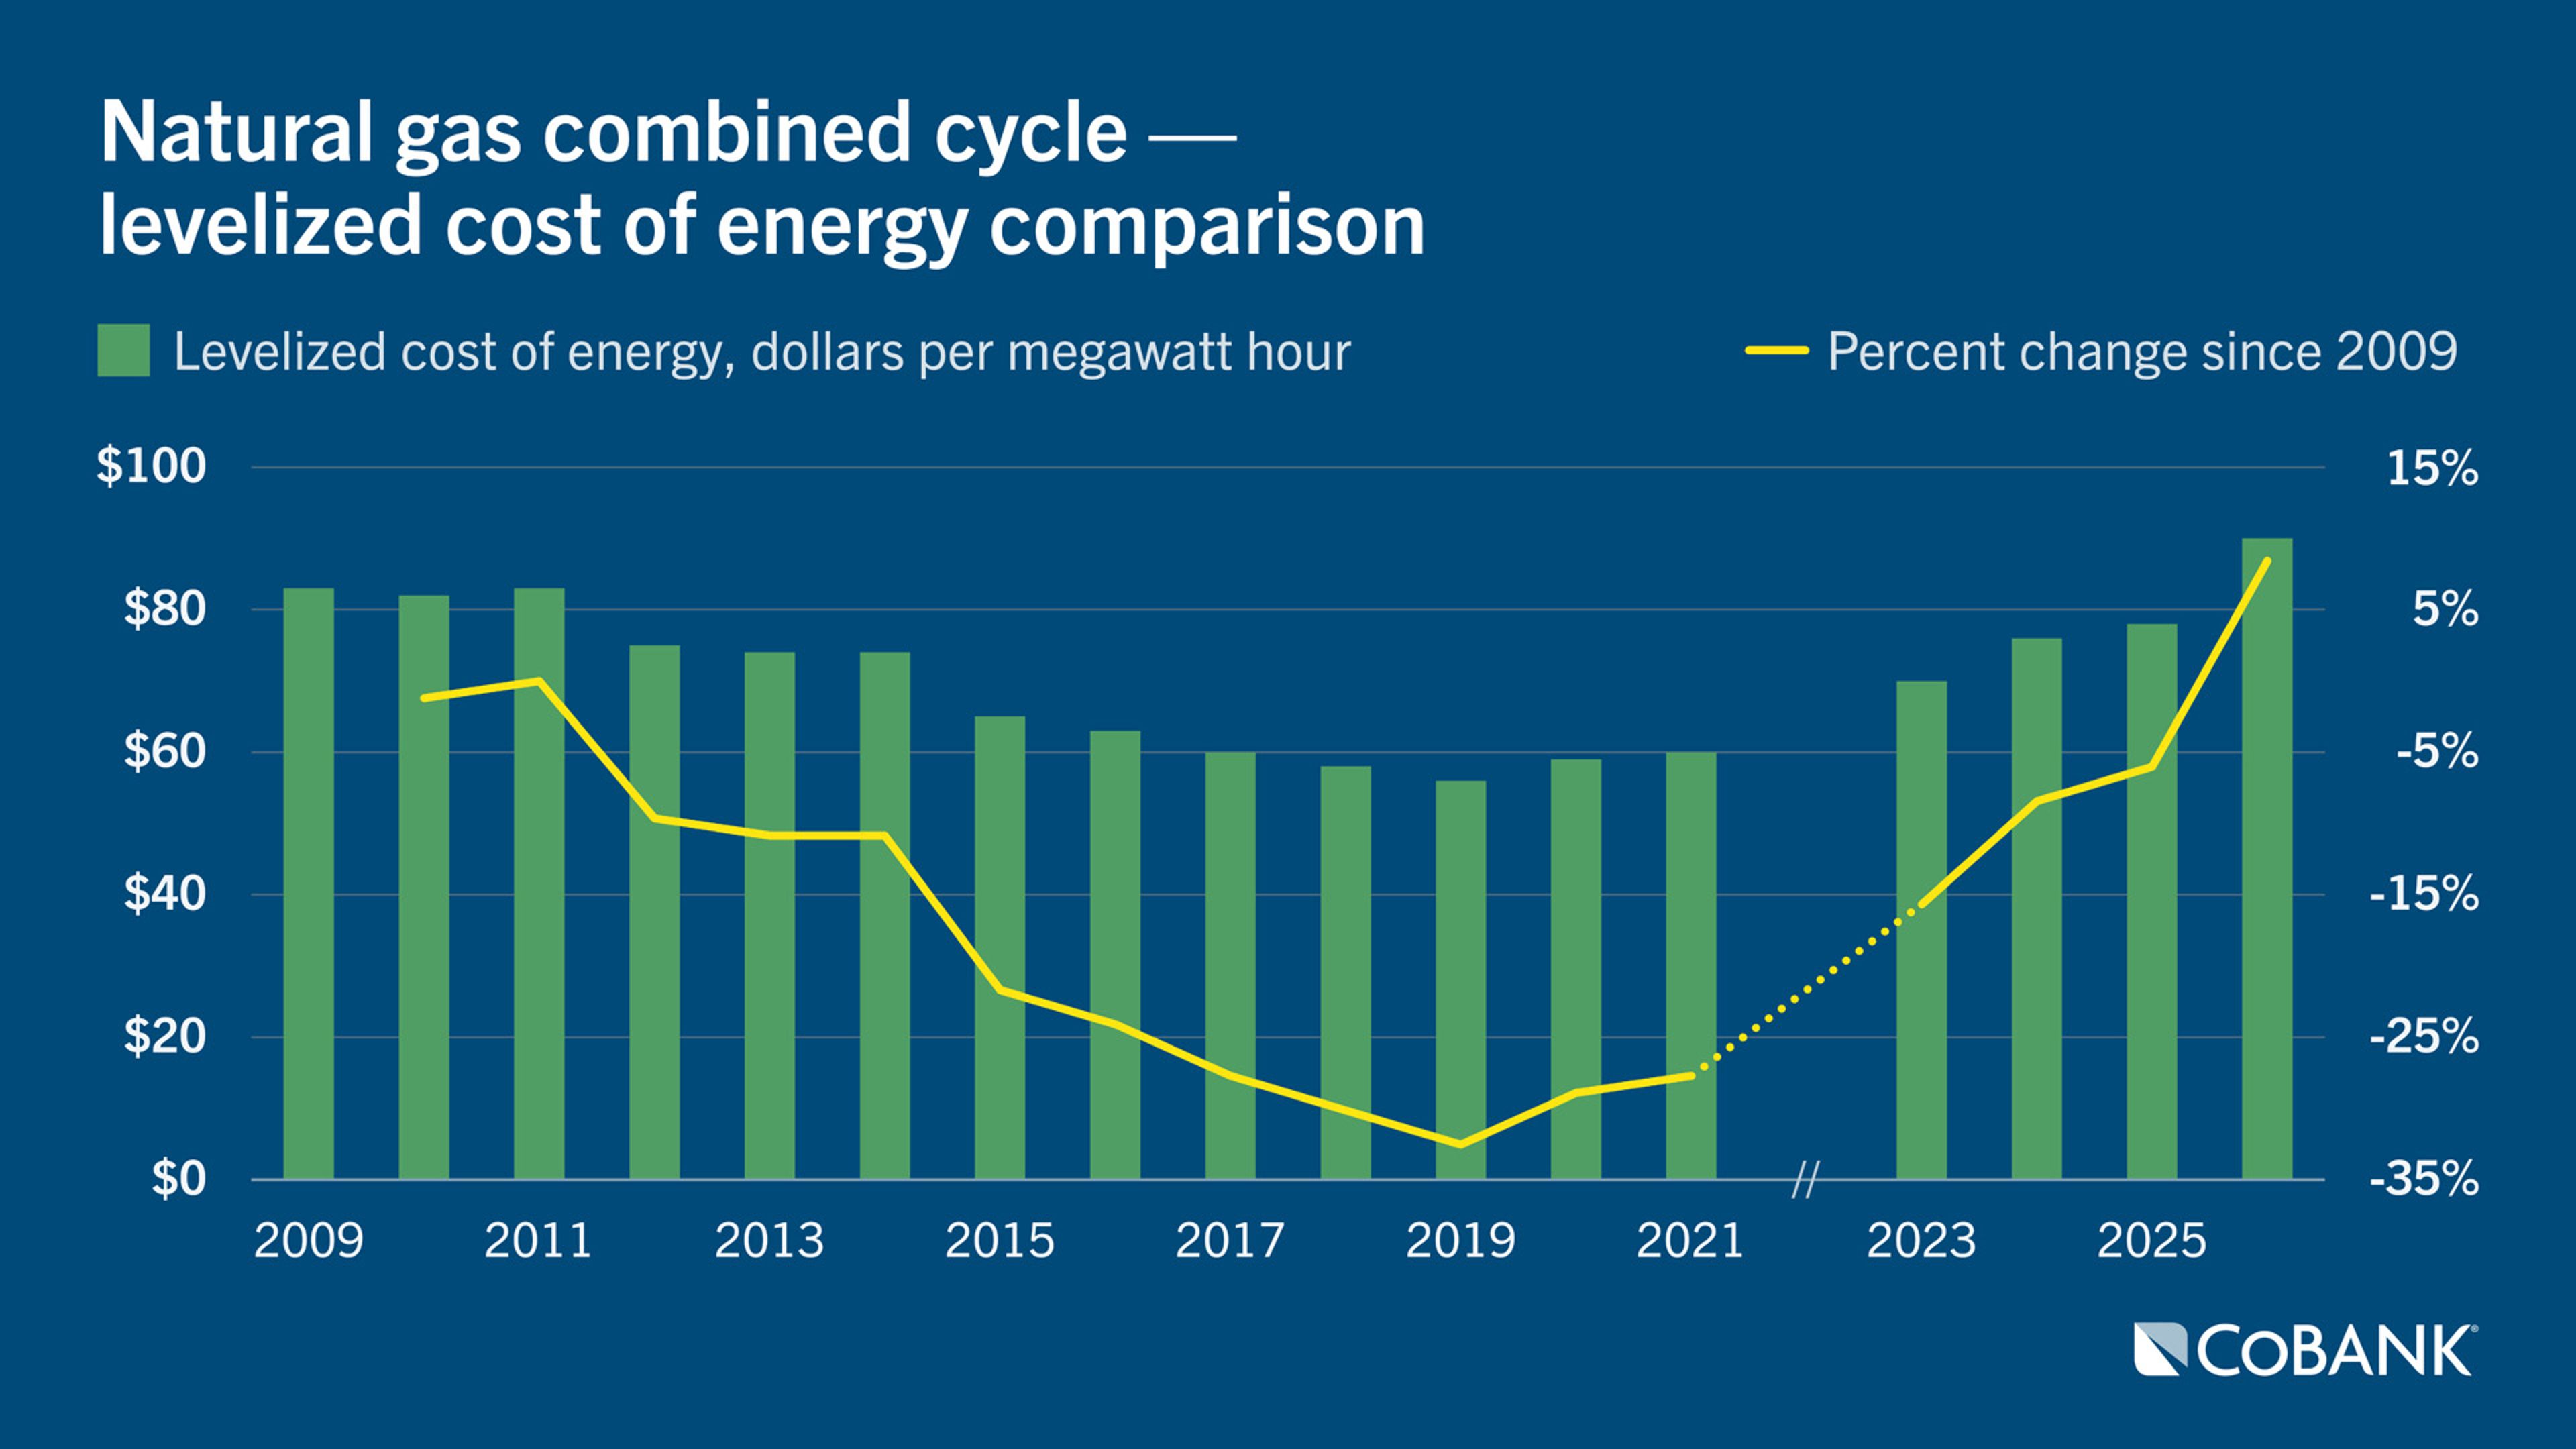
Equipment shortages and system bottlenecks are widespread — and each constraint makes the others harder to solve. Heavy-duty gas turbine lead times can extend beyond five years, and wait lists for generator step-up transformers and other large power transformers are also multiple years. Heat recovery steam generators, switchgear, controls, specialty steel and skilled labor add further delay and cost. Unlike the prior cycles, when technology costs reliably fell each year, today’s equipment scramble is sharply reversing that trend. According to Lazard’s latest levelized cost of energy analysis, power from U.S. natural gas-fired plants has reached its highest cost in roughly two decades and is likely to rise further as data center demand accelerates. Combined-cycle gas generation climbed to $90 per megawatt-hour in 2026, up from $78 a year earlier and above the 2009 level of $83, the earliest year in the Lazard dataset.
Grid access has become equally challenging. Interconnection queues are more congested, network upgrade costs are rising, and new gas plants must compete for transmission capacity alongside renewables, storage and large new loads. Fuel deliverability is also less assured than in prior eras. During the shale cycle, major interstate pipeline additions helped unlock basin supply and support coal-to-gas switching. Today, pipeline development is more contested, more uneven geographically and increasingly tied to LNG export corridors and basin egress, rather than broad domestic power-sector relief. Together, these frictions make natural gas highly attractive as a dispatchable resource, but much less scalable in practice than headline development totals suggest.
The changing sponsor mix could further intensify these constraints, as large power buyers look beyond incumbent independent power producers for faster paths to power. A recent Jefferies note found investor interest shifting toward behind-the-meter providers that can bring generation online quickly, rather than incumbent IPPs whose portfolios may not fully address resource adequacy or AI load growth. These less visible suppliers may be able to avoid lengthy transmission upgrades and other regulatory hurdles. Yet, hyperscalers remain wary of any arrangements that could undermine their social license or policy goals.
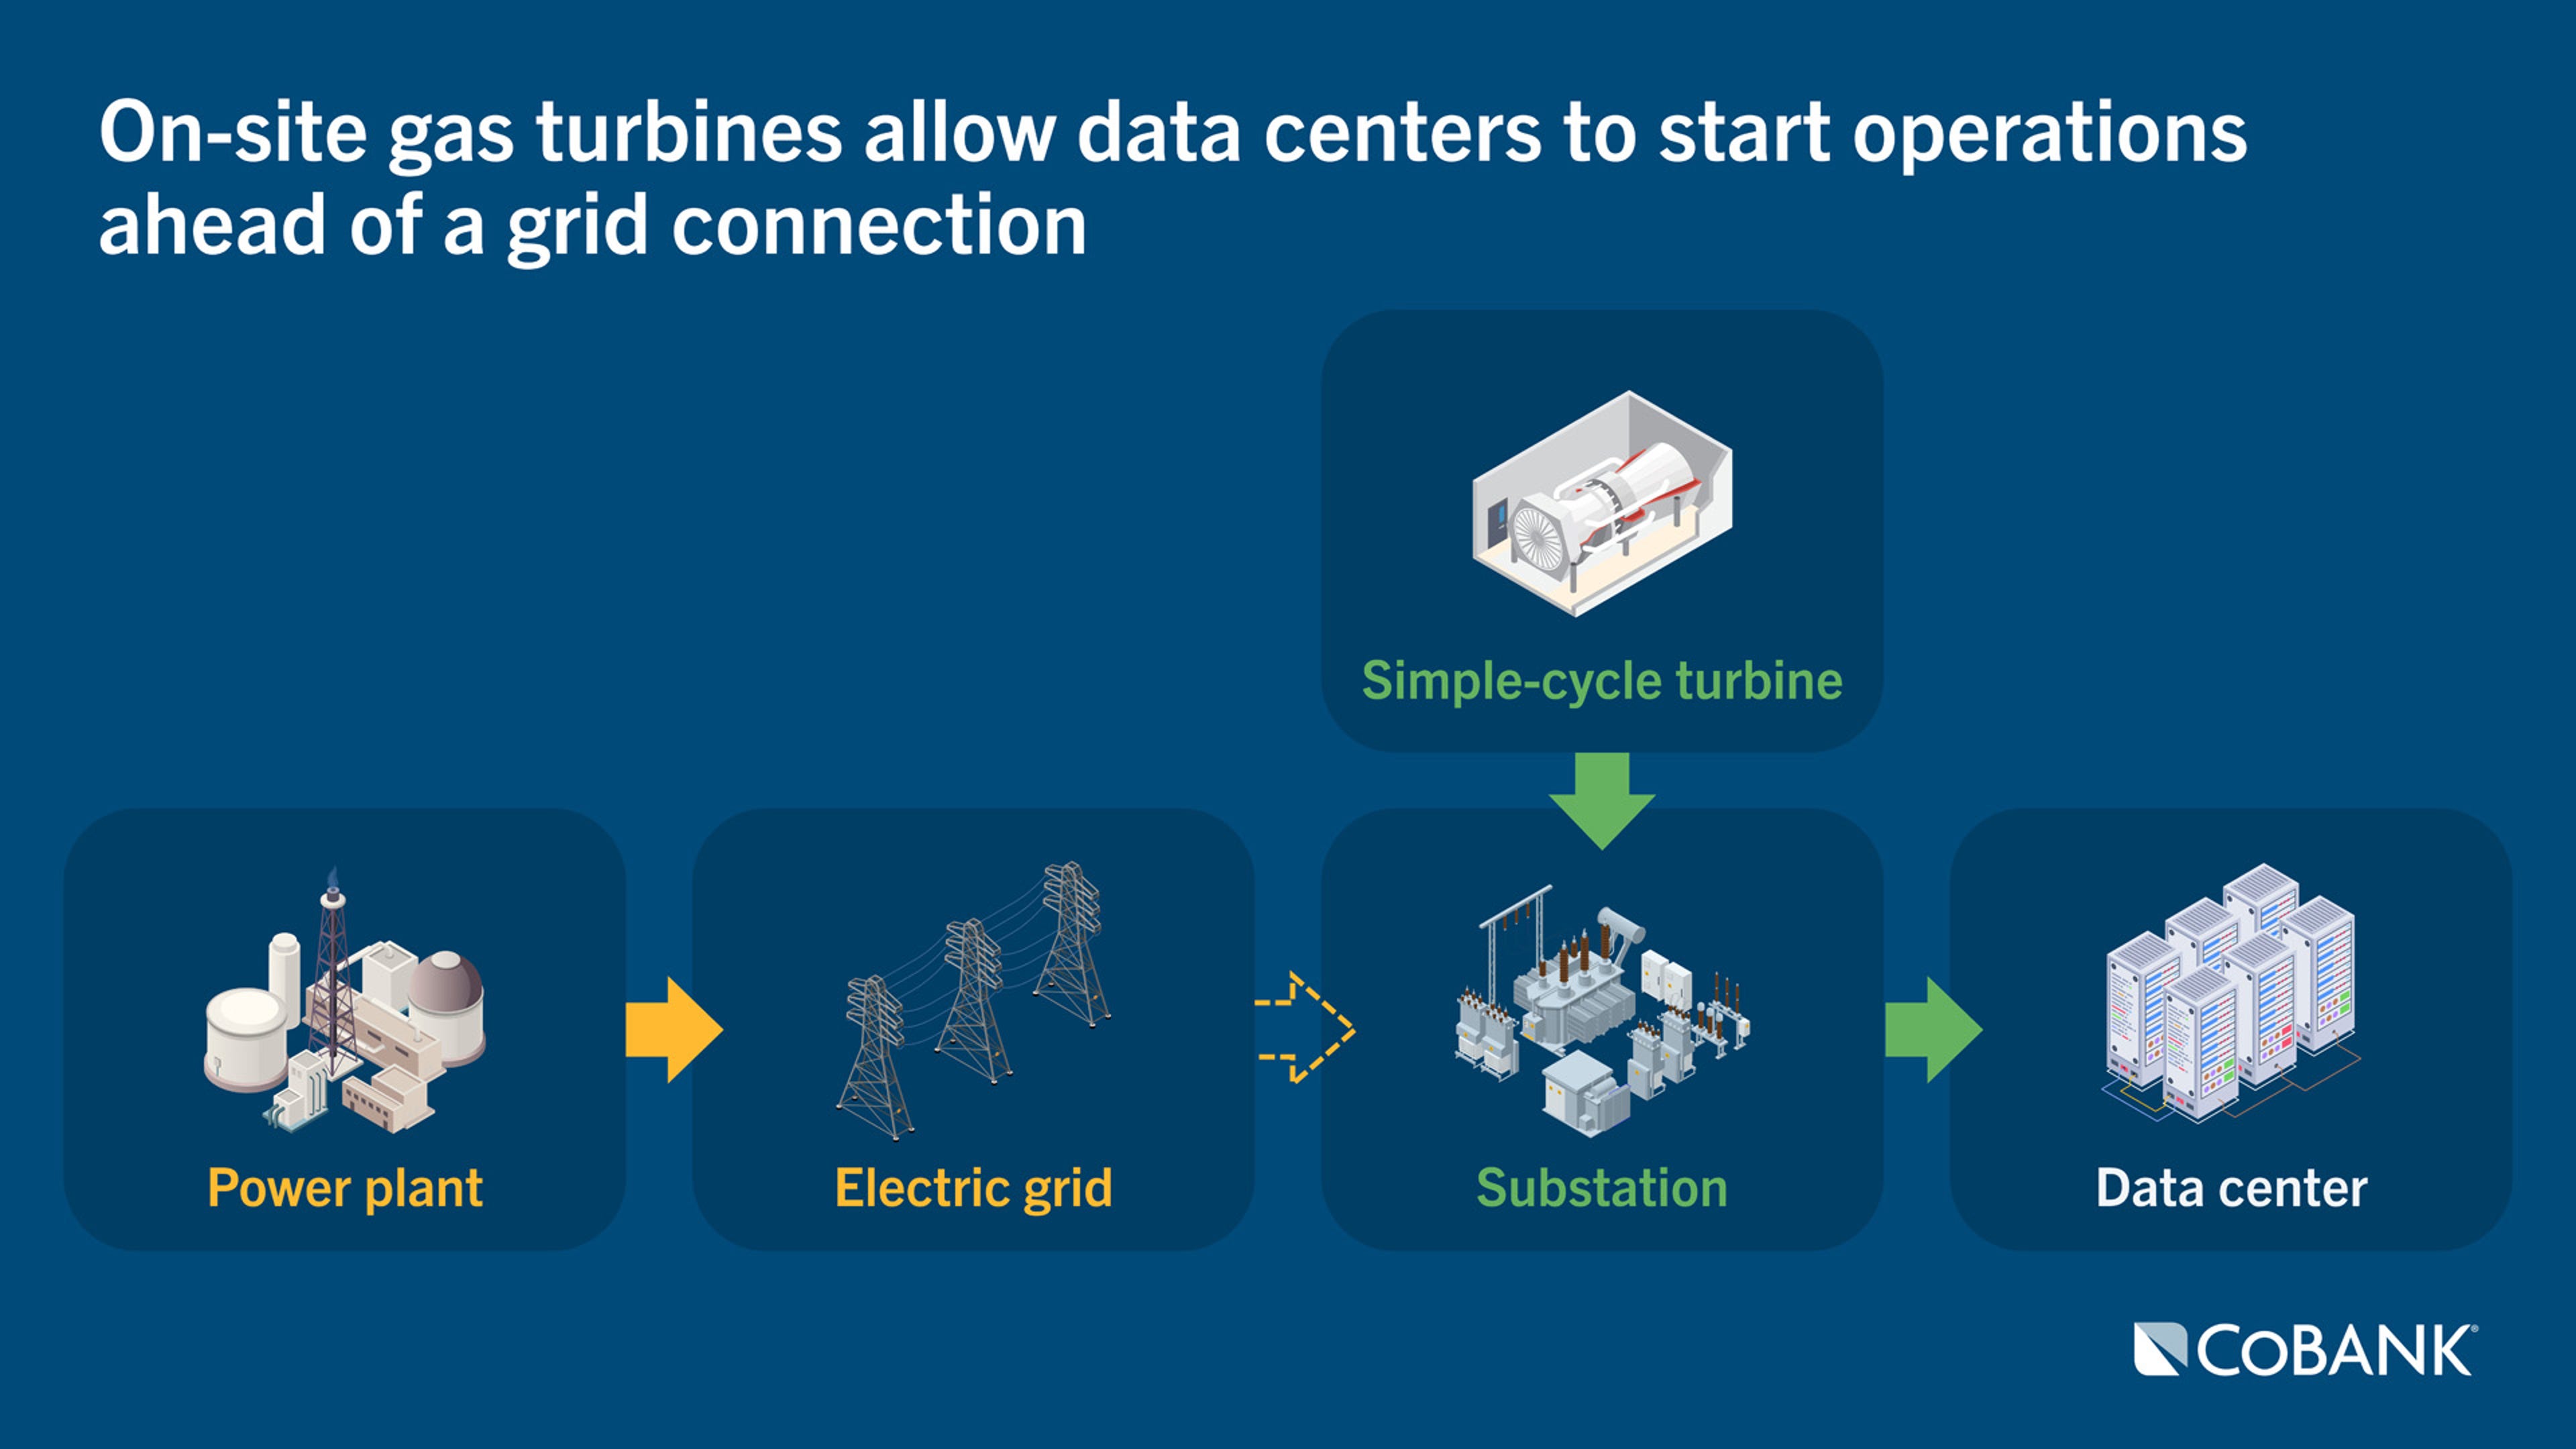
A broader sponsor base is likely to accelerate project announcements while heightening competition for turbines, transformers, transmission access, engineering talent and fuel infrastructure. Capital-rich entrants could secure scarce manufacturing slots or interconnection positions first, pushing smaller or less advanced projects farther back in the queue. And while many new sponsors appear willing to pay aggressively for power, higher interest rates make schedule risk more costly and delays more consequential than in earlier build cycles.
Meanwhile, grid operators and state commissions are increasingly requiring large loads to accept interruptible service, join demand response programs or provide backup generation or batteries to support reliability. FERC’s recent Section 206 “Show Cause” orders force regional grids to justify or overhaul large-load connection processes and formalize flexible-load agreements that allow curtailment or remote disconnects to defer or reduce network upgrades. These requirements could help manage reliability risks, but they also add another layer of negotiation, cost allocation and project uncertainty to an already crowded development space.
A new merchant headwind is also emerging. The solar-heavy plus battery buildout that has dominated capacity additions since 2020 continues into 2026, compressing daytime net load and lowering combined-cycle utilization. That makes merchant gas economics increasingly dependent on fewer, higher-value scarcity and reliability hours.
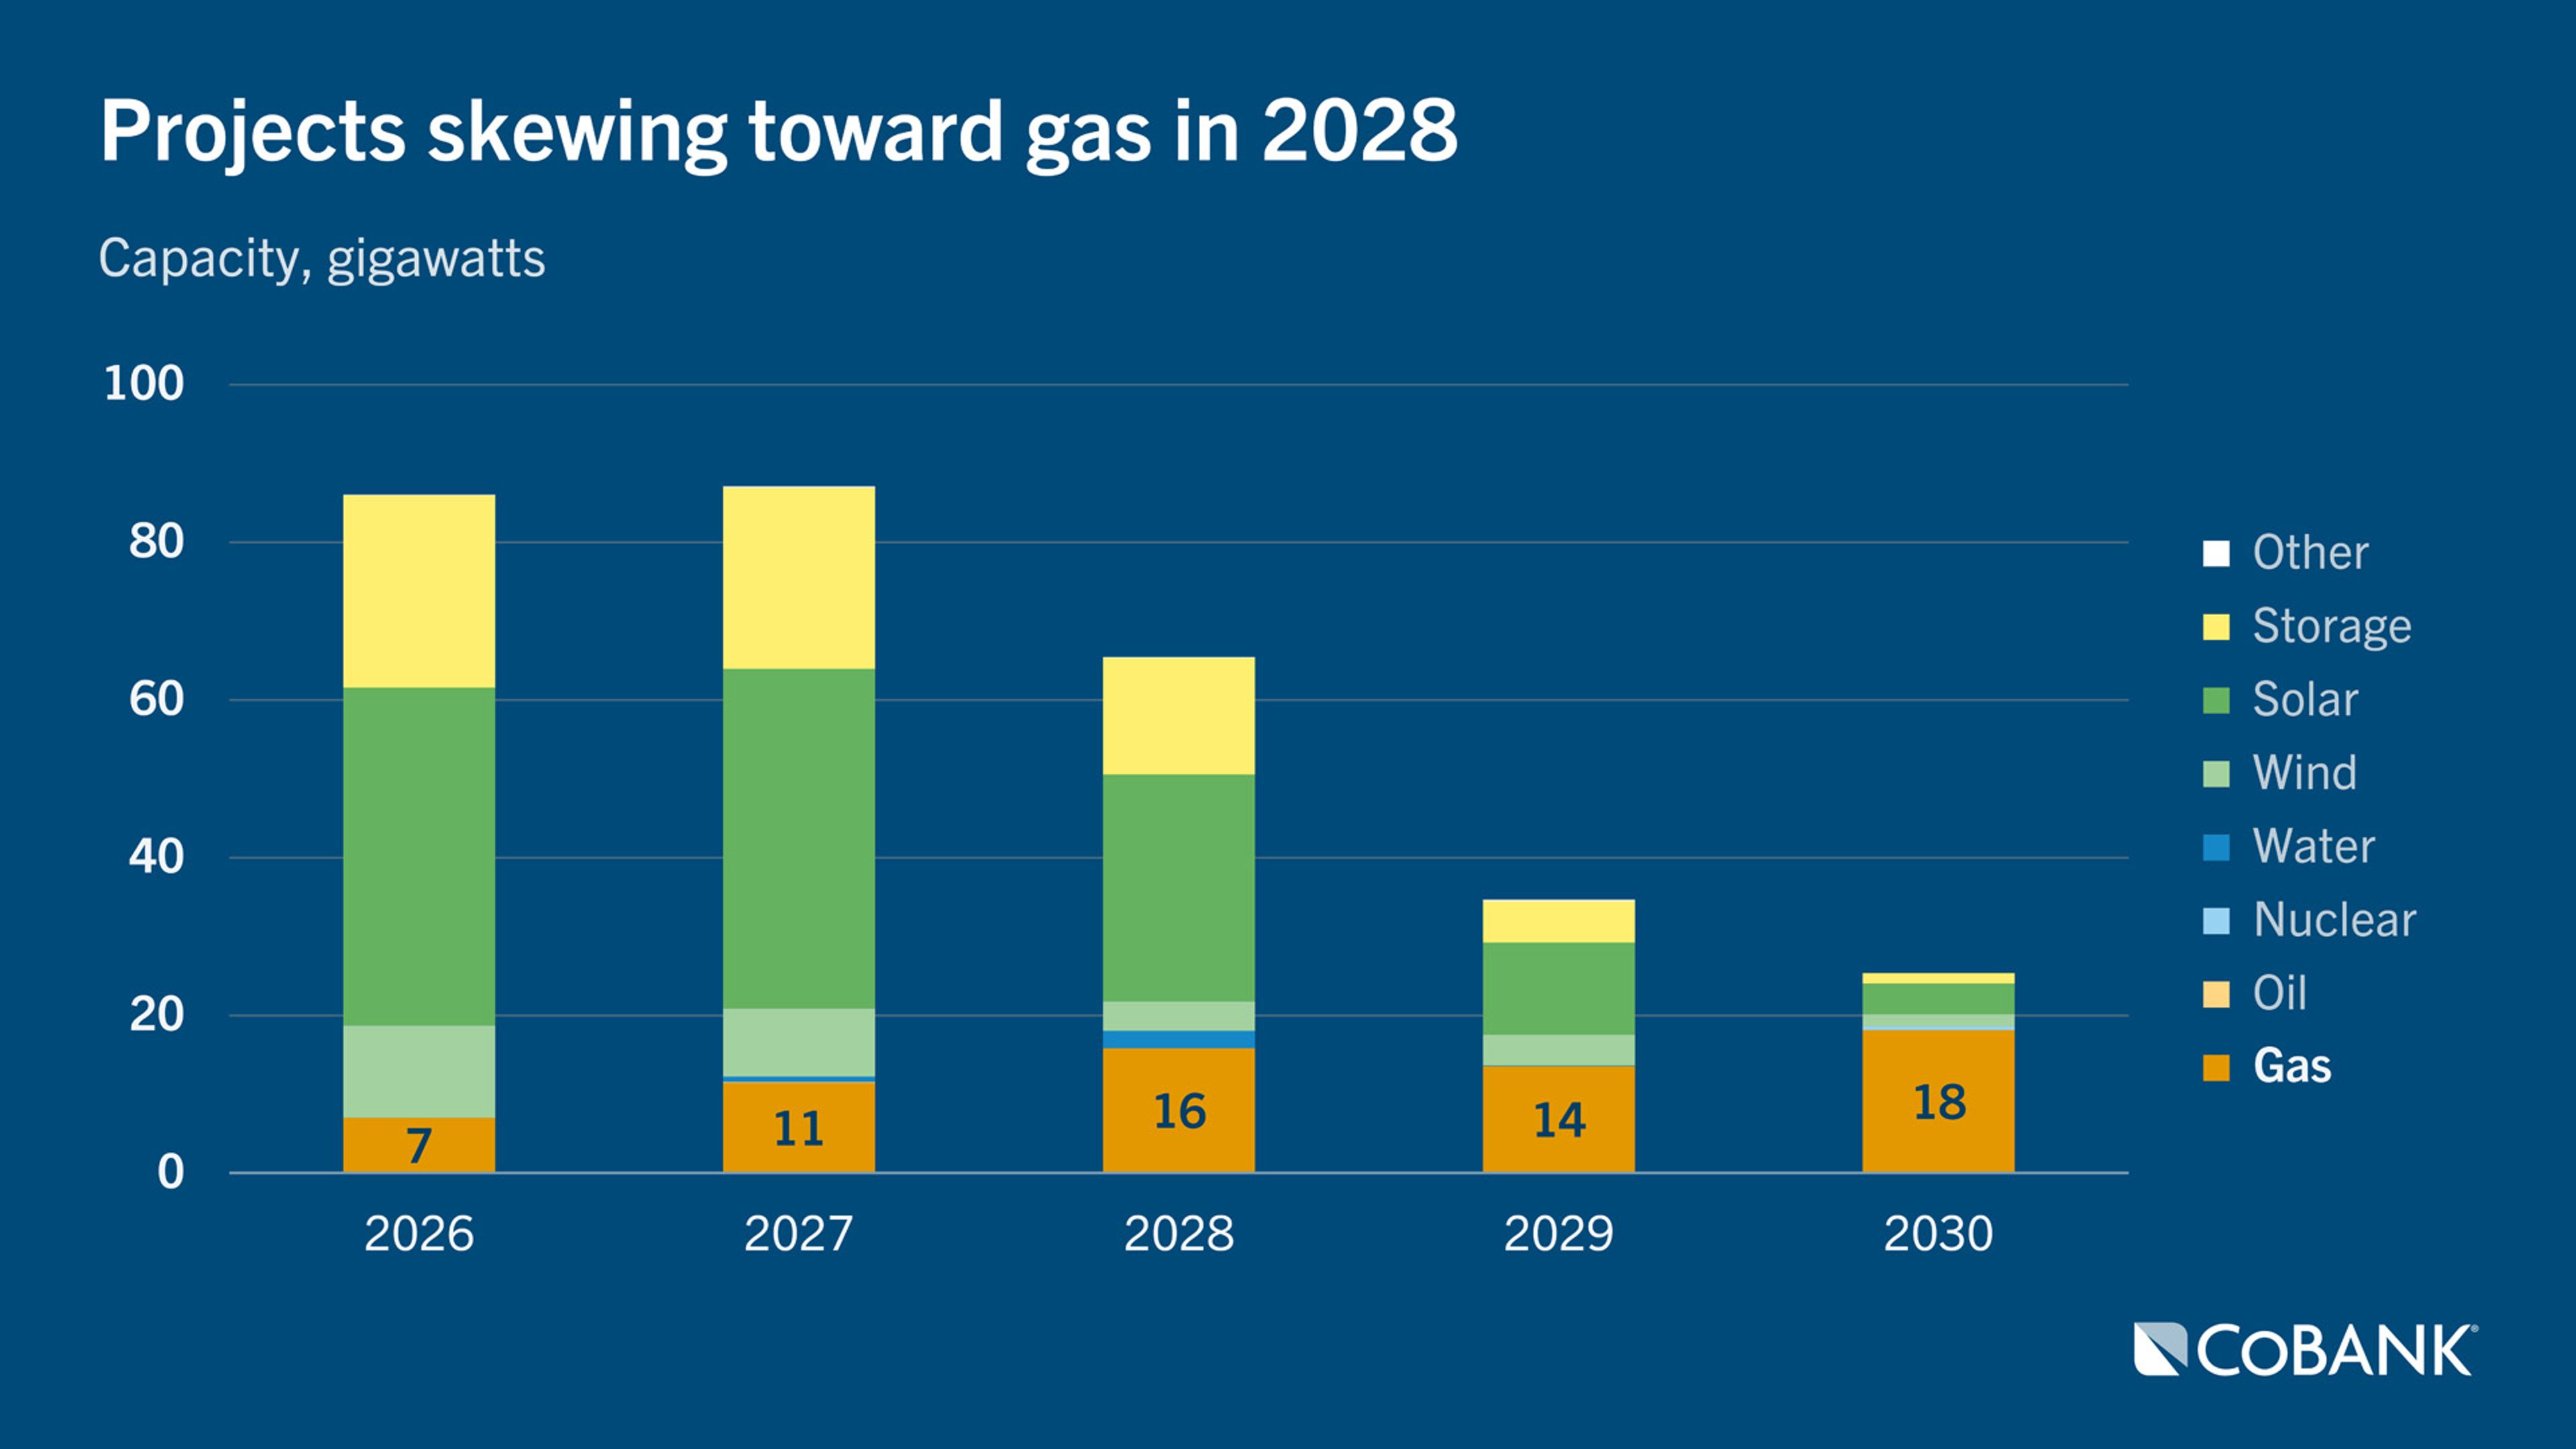
The most likely outcome is a cycle defined more by announcements than by ribbon cuttings. Annual gas additions from 2027 to 2035 will likely exceed the roughly 10 GW average recorded during the shale era from 2006 to 2018, but they are still unlikely to approach the merchant boom of 1999 to 2005, when gas additions averaged more than 30 GW per year. More important, competition for equipment, interconnection access and fuel infrastructure is likely to keep realized build rates well below the pace needed to expand the U.S. gas fleet by 50% by 2035. A more modest 15 to 20 GWs of annual additions appears more realistic given the current EIA planned pipeline.
Speed-to-power threatens to leave some consumers behind
In this new, emerging cycle, only projects with execution certainty will advance.
The strongest candidates will have well-capitalized sponsors able to absorb schedule and cost risk, reserve turbines and transformers early, secure credible interconnection paths and demonstrate reliable fuel access. That advantage is likely to favor developers with creditworthy offtake agreements and balance sheets strong enough to carry delays. The challenge is that more than half of planned data center capacity in interconnection queues comes from developers with limited operating experience. Projects lacking equipment reservations, firm fuel-deliverability plans, clear paths through transmission studies and credit-worthy customers are more likely to be delayed, downsized or withdrawn.
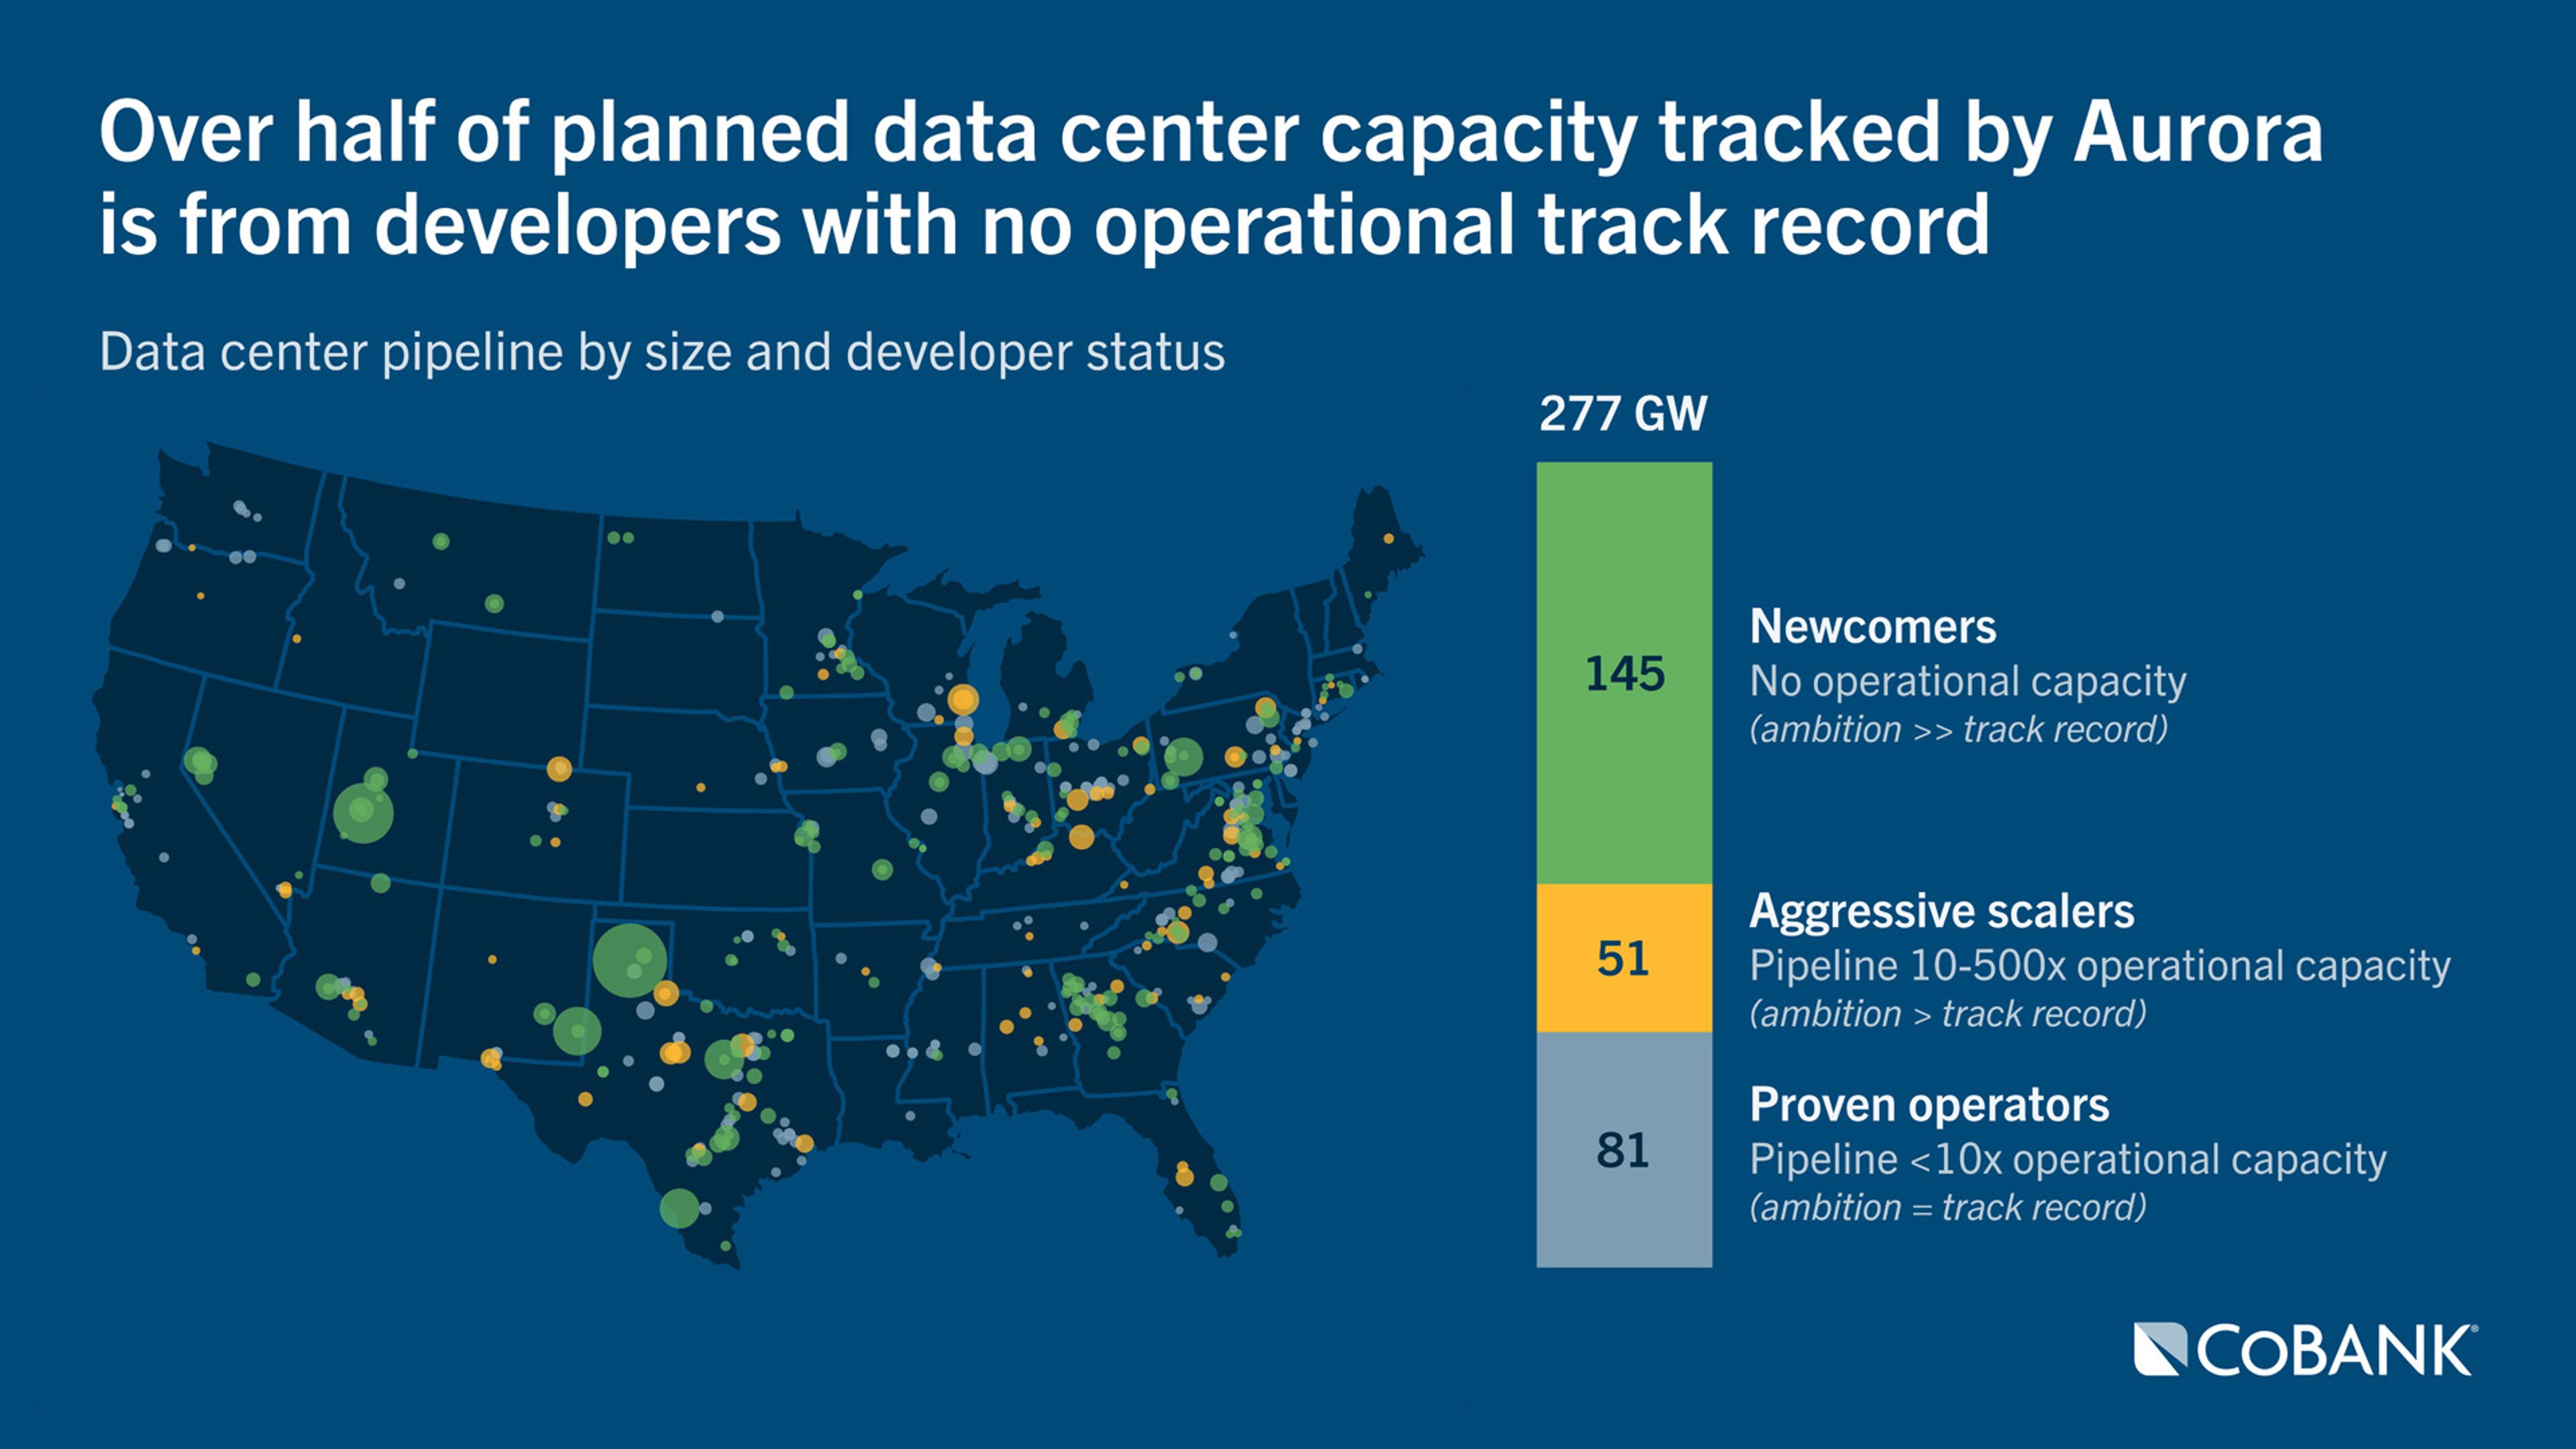
The result could be a more uneven development landscape rather than a broad-based expansion of supply that fully serves the public interest. Scarce resources may flow first to projects sponsored by the largest and most capitalized customers, even when broader system needs remain unresolved.
Regulatory policy is still forming around this problem. FERC’s market restructure is expected to standardize large-load interconnection procedures. It may also create pathways for co-located or “bring-your-own-generation” arrangements. Those reforms are intended to make large-load interconnection timelier and more orderly. But they could also have unintended consequences. Expedited pathways effectively give preferential treatment to customers able to self-supply or underwrite dedicated generation while socializing remaining reliability and affordability pressures across the wider system. The result is not just a slower gas buildout, but a widening mismatch between firm supply additions and large-load growth.
The scale of a more muted supply push becomes clearer in a middle-of-the-road speed-to-power case. The comparison with projected data center load growth shows the likely mismatch. S&P Global projects U.S. data center demand will rise from roughly 76 GW in 2026 to 134 GW by 2030, an increase of about 60 GW. That growth is not simply large; it is operationally different from most historical load additions because AI-focused data centers require high-capacity, round-the-clock service. They also have limited ability to shift usage away from constrained hours.
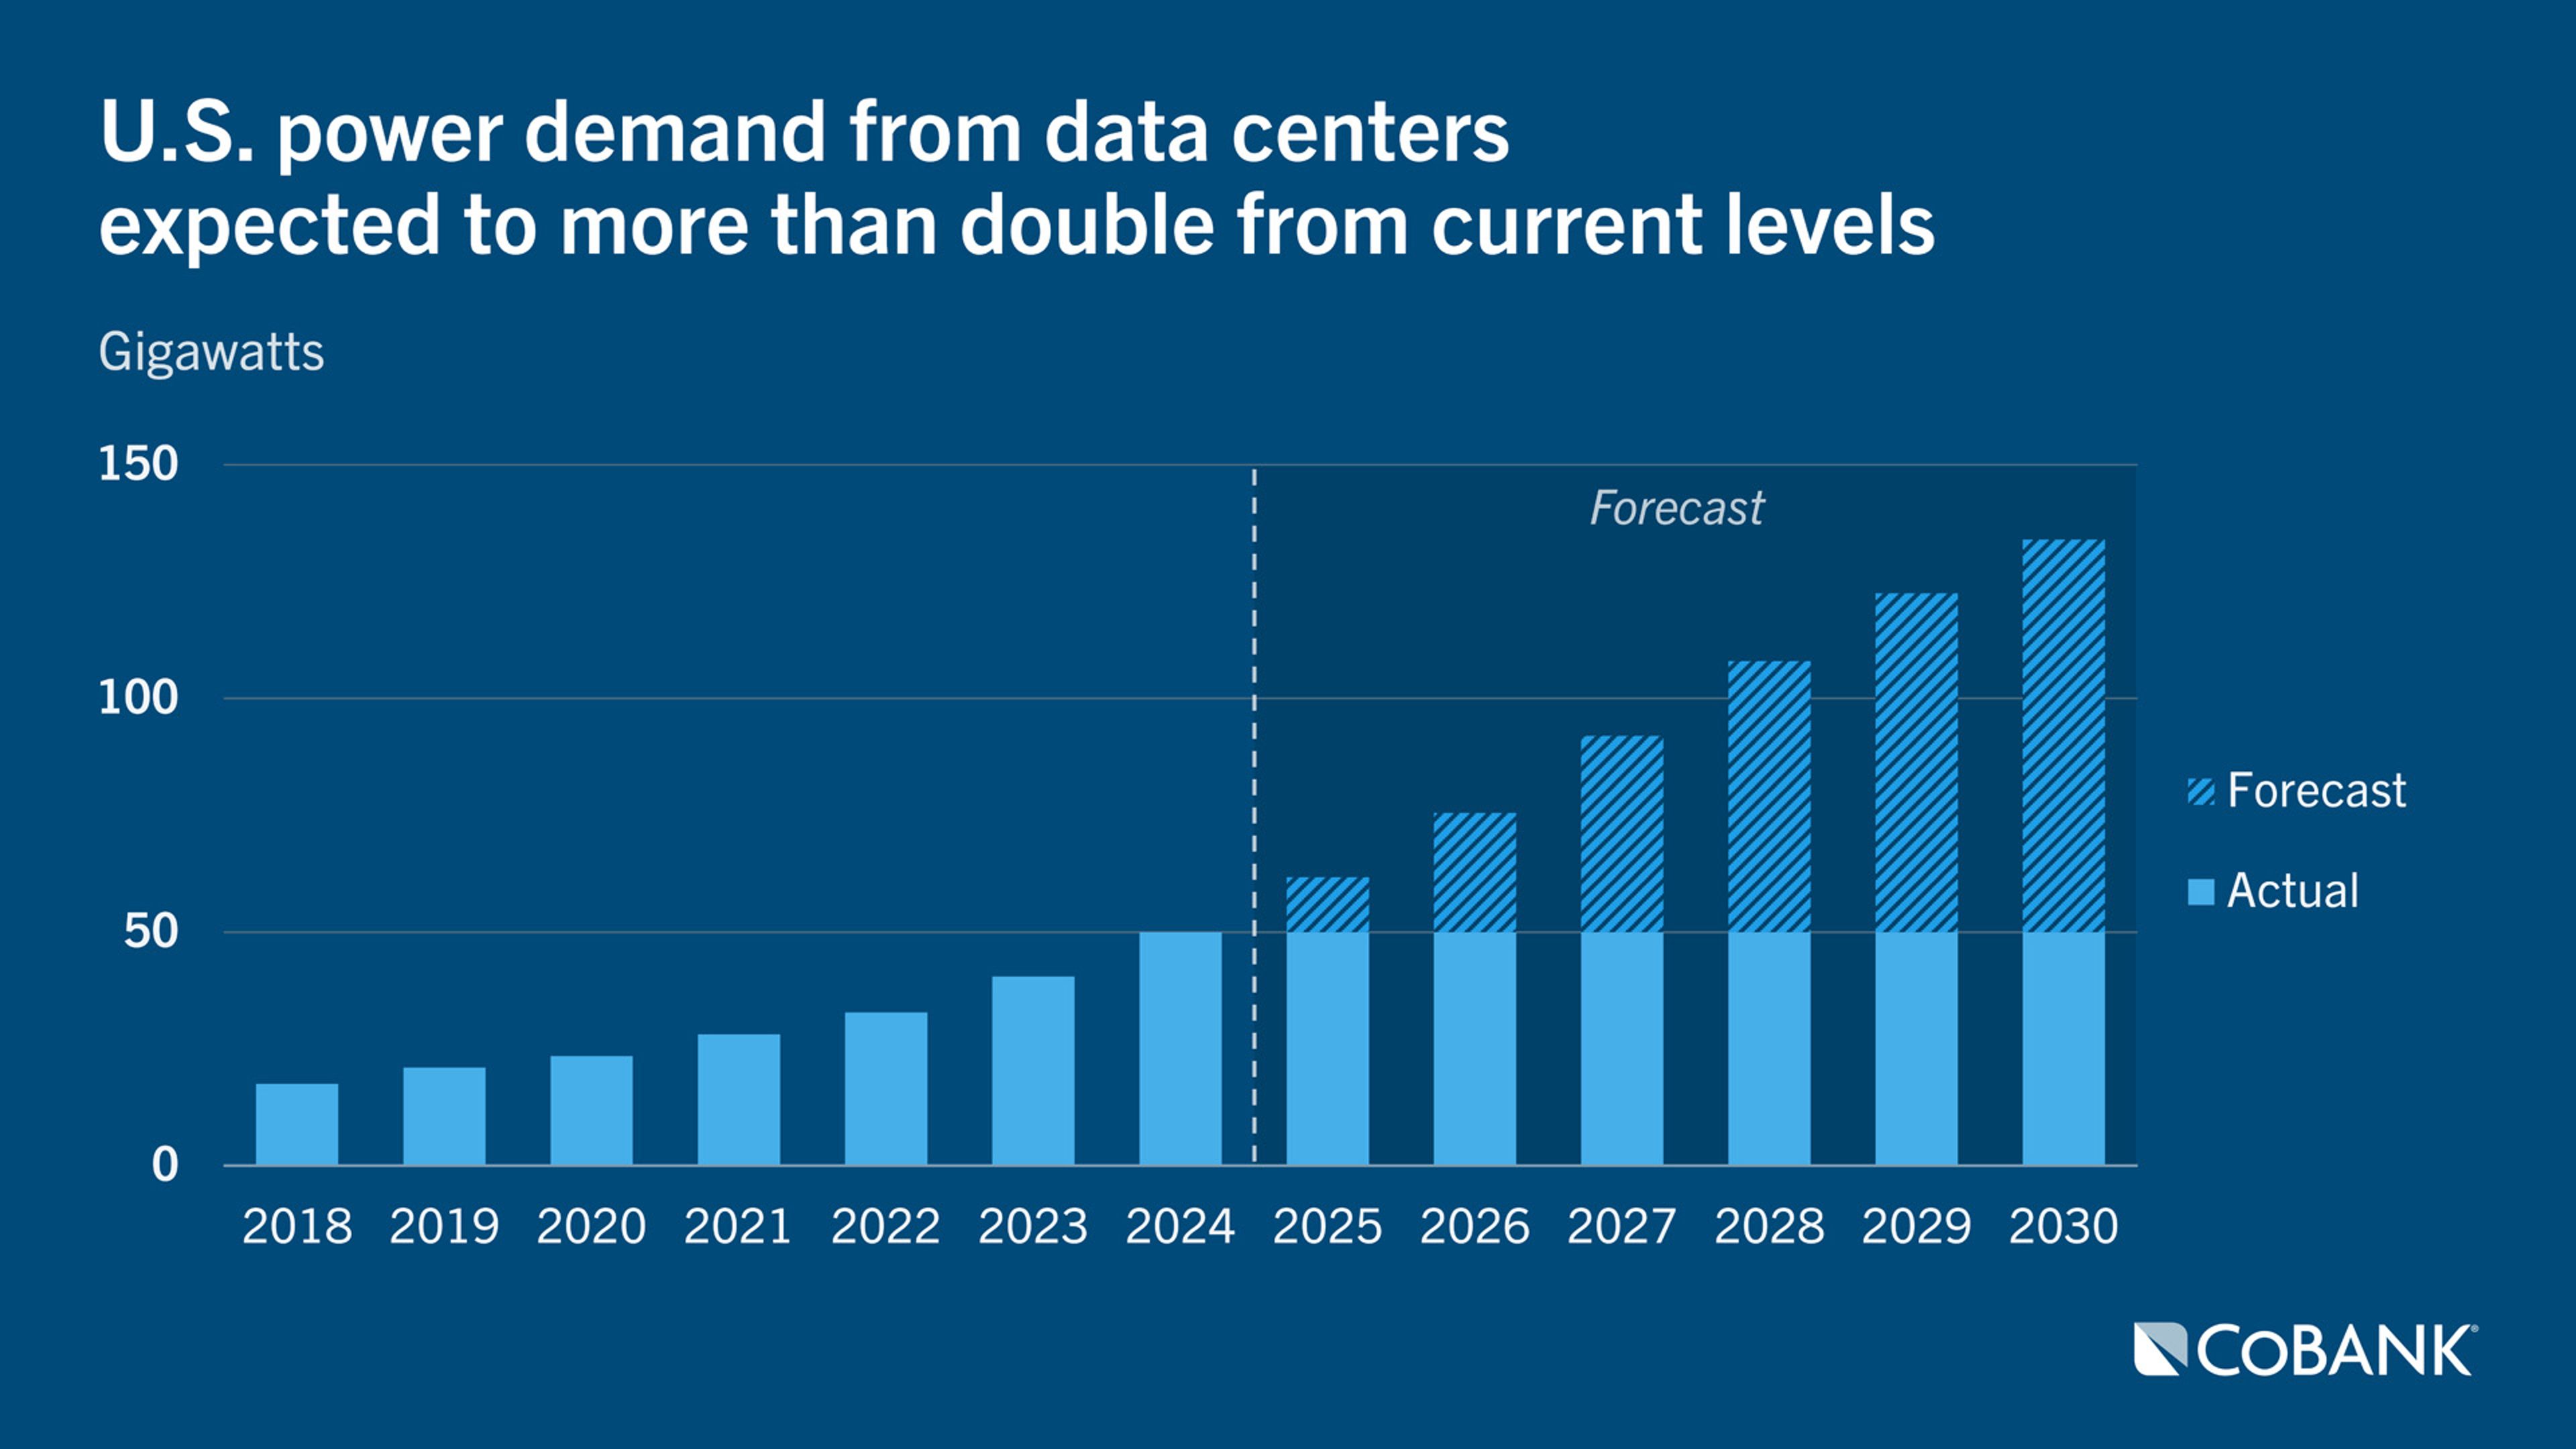
Even if annual gas additions reach the upper end of our guidance at roughly 20 GW, that capacity would satisfy only part of emerging large-load demand. It would also need to serve broader reliability, coal-retirement replacement and reserve margin needs. Nor would all new gas capacity be located where data centers are clustering, given growing geographic constraints on generation, transmission and fuel infrastructure. The result is a widening gap between how quickly firm, dispatchable power can be built and how quickly large loads want to connect. That gap will force utilities and regulators to decide whether those customers should receive firm service, accept curtailment risk or fund dedicated generation and infrastructure.
That shortfall is where project-level development risk becomes a broader market problem. When large-load demand grows faster than firm supply can be added, reserve margins remain tighter for longer and scarcity pricing becomes more likely during constrained hours. In short, the new gas buildout will not be a broad-based capacity solution. It will be a competition for scarce execution capacity, and the costs will likely flow through to consumers.
How co-ops can stay ahead of a tighter power market
For electric cooperatives, the key lesson is not to avoid natural gas, but to avoid relying on any single resource or procurement path to solve a broader supply-adequacy challenge. A slower and more selective gas buildout reinforces the need for agile, diversified procurement programs that combine owned generation, bilateral purchases, market hedges, storage, renewables and flexible contracting where appropriate. Co-ops that stage procurement decisions, preserve optionality and evaluate projects against realistic equipment, interconnection and fuel-deliverability timelines will be better positioned than those that assume announced capacity will arrive on schedule.
Tactical load management and demand response should also become more central to cooperatives’ planning. In a market where dispatchable supply is increasingly scarce, the ability to reduce or shift demand during constrained hours can serve as a practical resource, not merely a customer program. Targeted demand response, interruptible service options, managed charging, flexible industrial load arrangements and peak-focused efficiency measures can help reduce exposure to scarcity pricing while buying time for new supply to materialize.
Typical data center request process from contact to connection
Development and infrastructure costs are incurred by the customer
1. High level assessment | Identify infrastructure requirements |
|---|---|
2. Engineering Letter of Authorization | Detailed engineering plan Costs reimbursed to the utility |
3. Construction Letter of Authorization | Authorizes construction Customer must reimburse the utility for all spent costs should they walk away |
4. Install infrastructure | Substation(s) High-voltage transmission lines Distribution lines |
5. Electric Service Agreement | Defines how the customer will take service and the structure to recover costs Includes revenue requirement whether customer takes service or not |
Finally, cooperatives will need to sharpen how they allocate the costs created by large-load growth. Data centers and other major new loads may bring economic development benefits, but they are also a primary driver of incremental capacity, transmission and fuel-infrastructure needs. The CoBank Knowledge Exchange resource A Guide for Serving Large Loads emphasizes that rate designs, contribution-in-aid-of-construction requirements, minimum demand charges, take-or-pay provisions and contract terms should ensure existing members are not left subsidizing highly concentrated new demand. The larger takeaway is straightforward: slower development of dispatchable supply means tighter power markets and higher electricity costs for longer, making disciplined procurement, active load management and cost-causation-based rate design essential tools for cooperative risk management.
Disclaimer: The information provided in this report is not intended to be investment, tax, or legal advice and should not be relied upon by recipients for such purposes. The information contained in this report has been compiled from what CoBank regards as reliable sources. However, CoBank does not make any representation or warranty regarding the content, and disclaims any responsibility for the information, materials, third-party opinions, and data included in this report. In no event will CoBank be liable for any decision made or actions taken by any person or persons relying on the information contained in this report.