
Higher-component herds capture bigger milk checks


Key points
- Higher-component dairy herds are earning meaningful milk check premiums. Across Federal Milk Marketing Orders, herds with higher butterfat and protein levels earn $101 to $352 more per cow annually than lower-component herds at average U.S. milk production.
- At a 90-pound tank average, that advantage grows to $136 to $474 more per cow annually. Those gains can add up quickly as herd size increases, especially in markets with wide butterfat and protein gaps between top- and bottom-performing herds.
- Butterfat and protein now drive most milk check revenue under Multiple Component Pricing as demand continues to shift from beverage milk toward cheese, whey and other manufactured dairy products.
- Component levels are rising quickly. Since 2011, U.S. butterfat levels have climbed 0.61 percentage points, while protein has gained 0.24 percentage points, widening the range of milk components delivered to U.S. dairy processing plants.
- As component production increases, traditional milk-volume measures such as rolling herd average no longer tell the full revenue story. Producers paid through component-based pricing can improve milk check revenue while supplying more of the milk solids processors need.
For decades, milk volume was the dairy industry’s dominant measure of production strength. Bigger tanks, higher rolling herd averages and more pounds per cow largely defined farm performance. But the value of milk has changed as consumer demand has shifted away from beverage milk and toward cheese, whey, butter and other manufactured dairy products.
That shift has elevated butterfat and protein from quality measures to core revenue drivers. Federal order pricing formulas have gradually followed the market, with Multiple Component Pricing now determining milk checks for much of the U.S. milk supply. As a result, the composition of milk increasingly matters as much as — and in some cases more than — the total pounds shipped.
This report grew out of an Upper Midwest Federal Milk Marketing Order analysis that broke herds into decile groups by component performance. CoBank expanded that approach across all seven federal orders that use Multiple Component Pricing to better understand how differences in butterfat and protein translate into milk check value. The findings show that component gains are no longer just a production trend; they are reshaping how dairy producers, processors and lenders should evaluate milk revenue potential.
Component gains are showing up in milk checks
Even small differences in butterfat and protein can create sizable milk check advantages. Across Federal Milk Marketing Orders that use Multiple Component Pricing, top-decile herds earn $101 to $352 more per cow annually than bottom-decile herds at average U.S. milk production. At a 90-pound tank average, that advantage widens to $136 to $474 per cow annually.
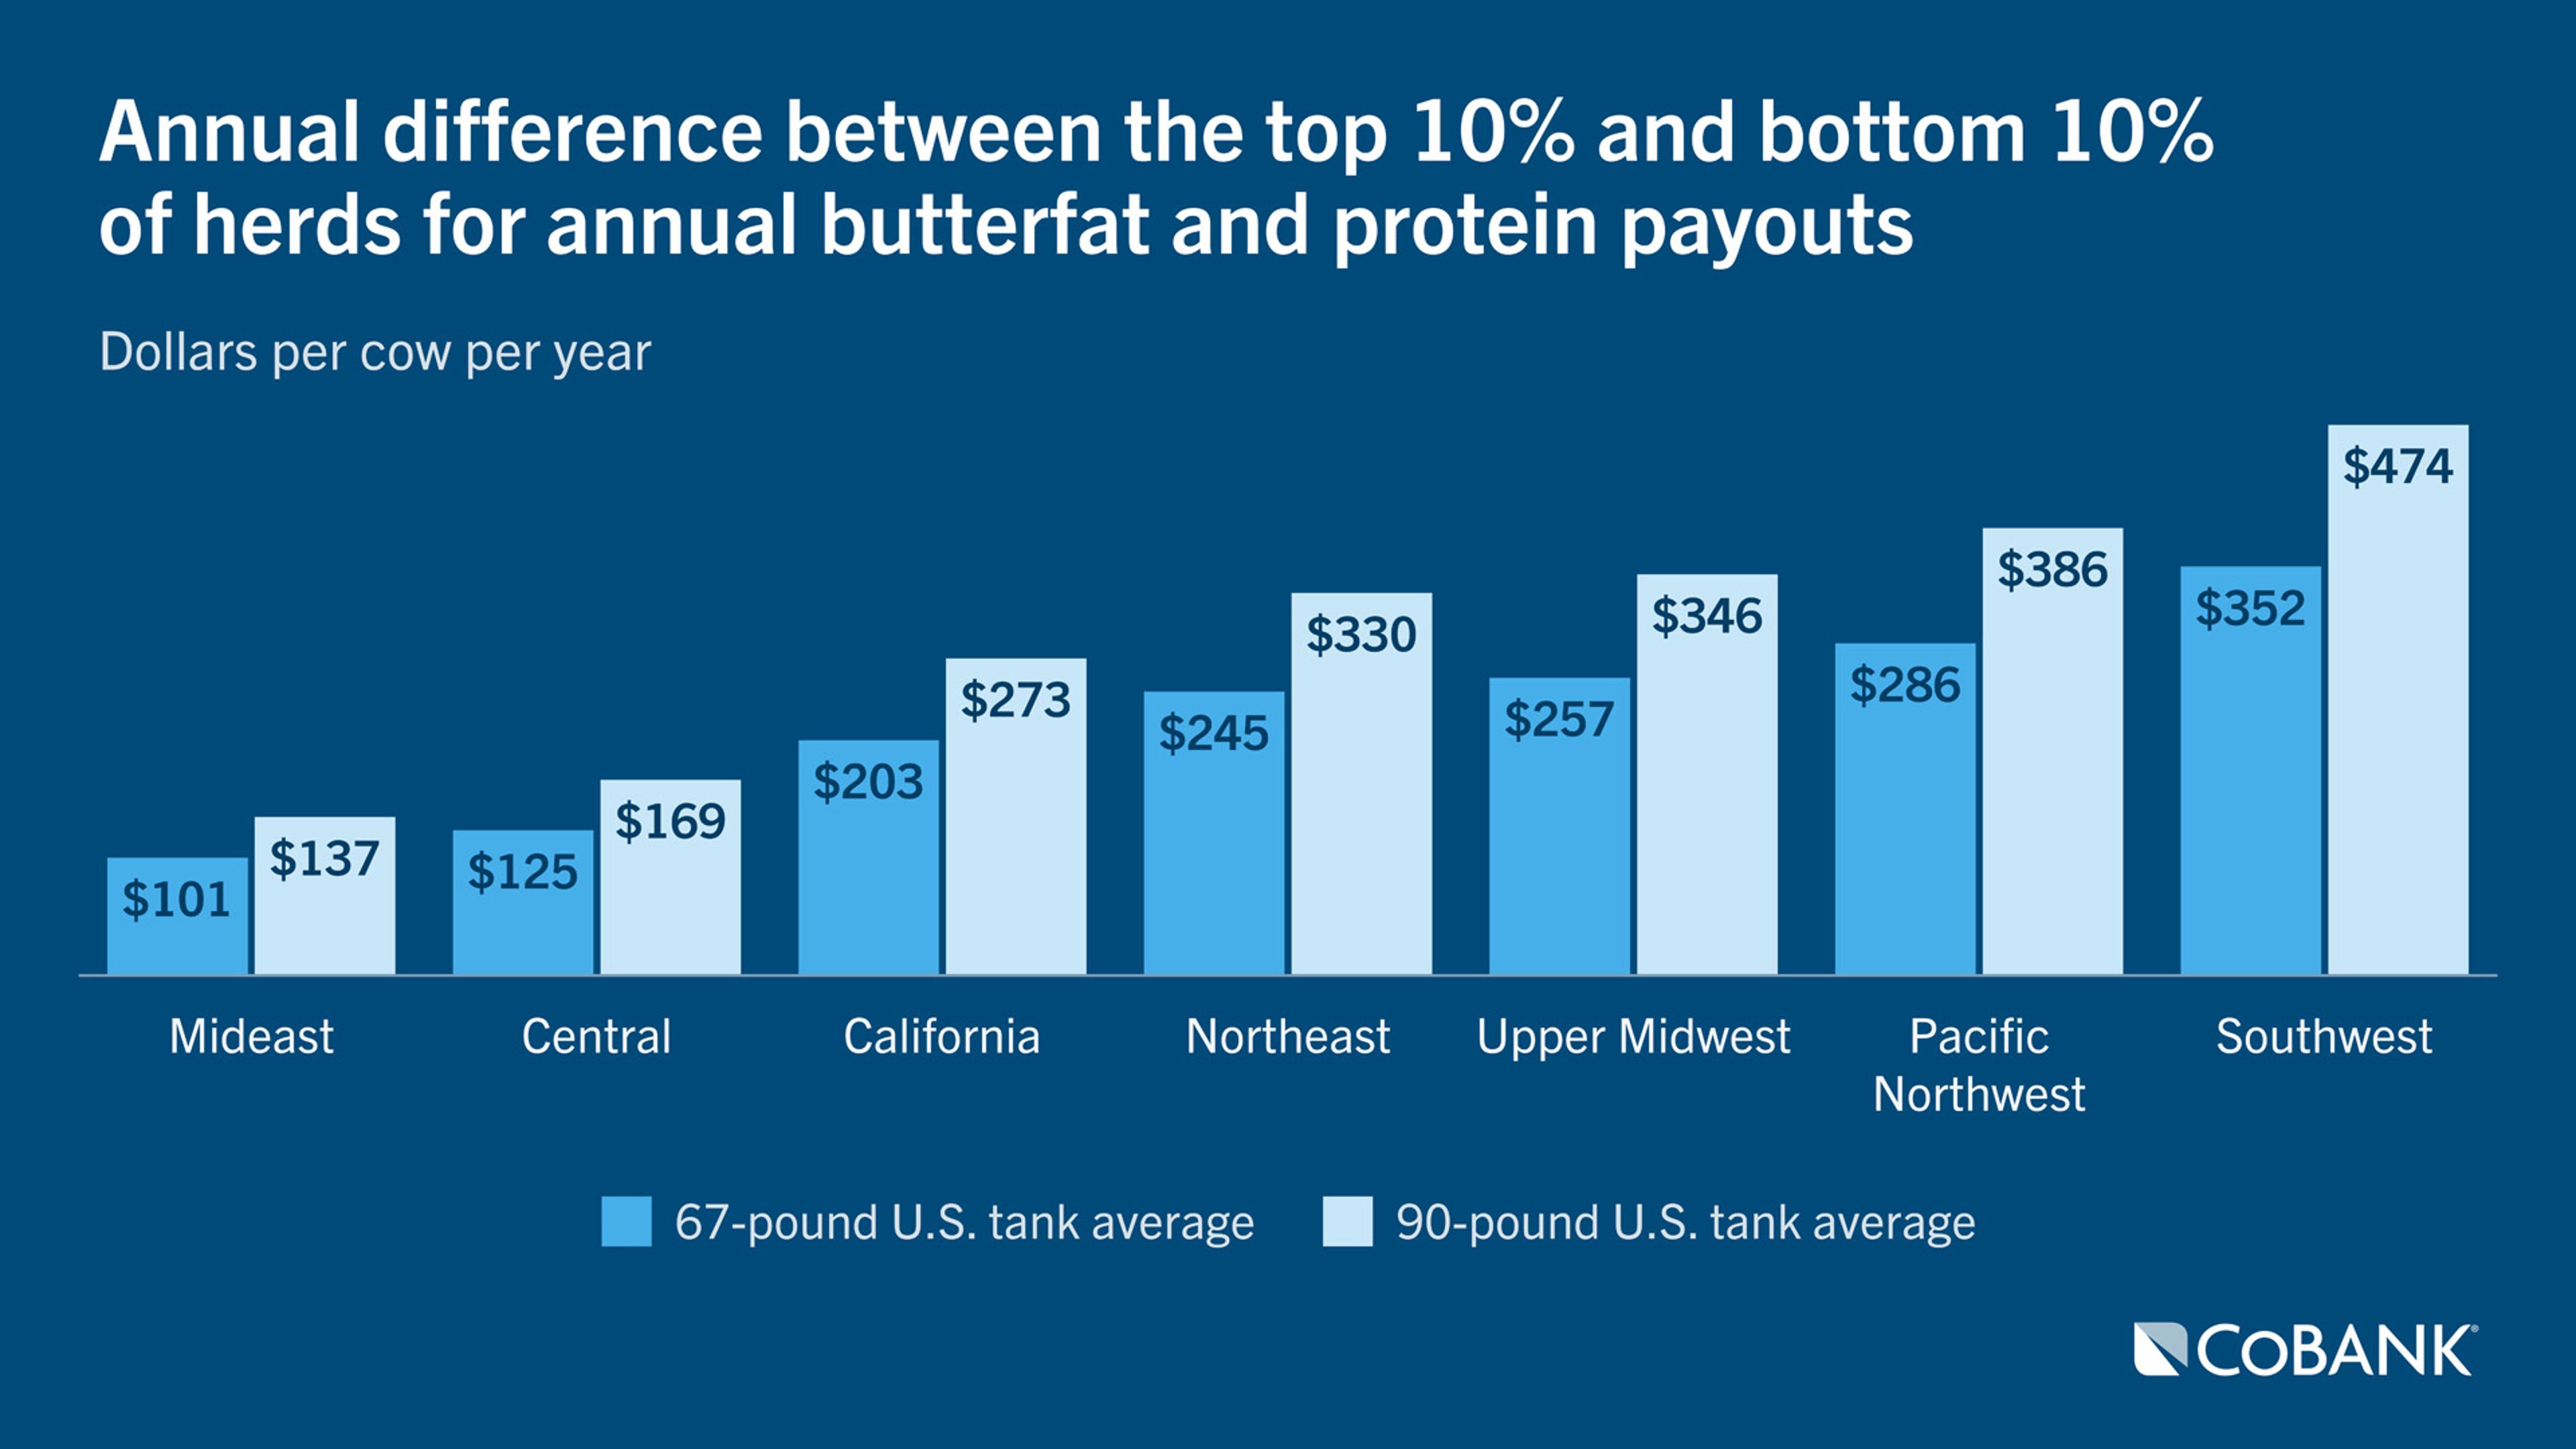
Scaled across a herd, those component gaps can represent hundreds of thousands of dollars in annual revenue. For a 1,000-cow dairy, the opportunity ranges from roughly $136,000 to $474,000, depending on the order and production level. That is why butterfat and protein are increasingly important revenue metrics alongside milk volume.
The Upper Midwest order shows how quickly those differences add up in a market built around manufactured dairy products. The order includes 5,599 herds and is heavily tied to cheese and whey production, especially in Wisconsin, which contributes nearly 60% of the order’s milk and sends nearly 90% of its milk into cheese.
Areerat Kichkha, an agricultural economist with the Upper Midwest FMMO, recently published an analysis of the FMMO’s component levels and values at the farm level. Table 3a broke out the Upper Midwest herds in 10 percentile groups, which ultimately served as the inspiration for this report and CoBank’s data requests to all seven orders with MCP provisions.
Milk components in the Upper Midwest order averaged 4.37% butterfat, 3.33% protein and 5.79% other solids in 2025. However, there were significant differences in butterfat and protein levels between the top 560 herds and the bottom 560 herds. Top-decile herds averaged 4.44% butterfat and 3.38% protein, while the lowest decile posted 4.16% butterfat and 3.23% protein. This created a 0.28 percentage-point difference in butterfat and a 0.15 percentage-point difference in protein.
Our first financial comparison used average 2025 U.S. milk production of 24,390 pounds per cow per year, based on USDA’s National Agricultural Statistics Service metrics. This equates to a 67-pound daily tank average.
At that production level, the top 10% of Upper Midwest herds produced 3.0 pounds of butterfat and 2.3 pounds of protein per cow per day, based on the previously cited 4.44% butterfat and 3.38% protein. The bottom 10% produced 2.8 pounds of butterfat and 2.2 pounds of protein, based on 4.16% butterfat and 3.23% protein.
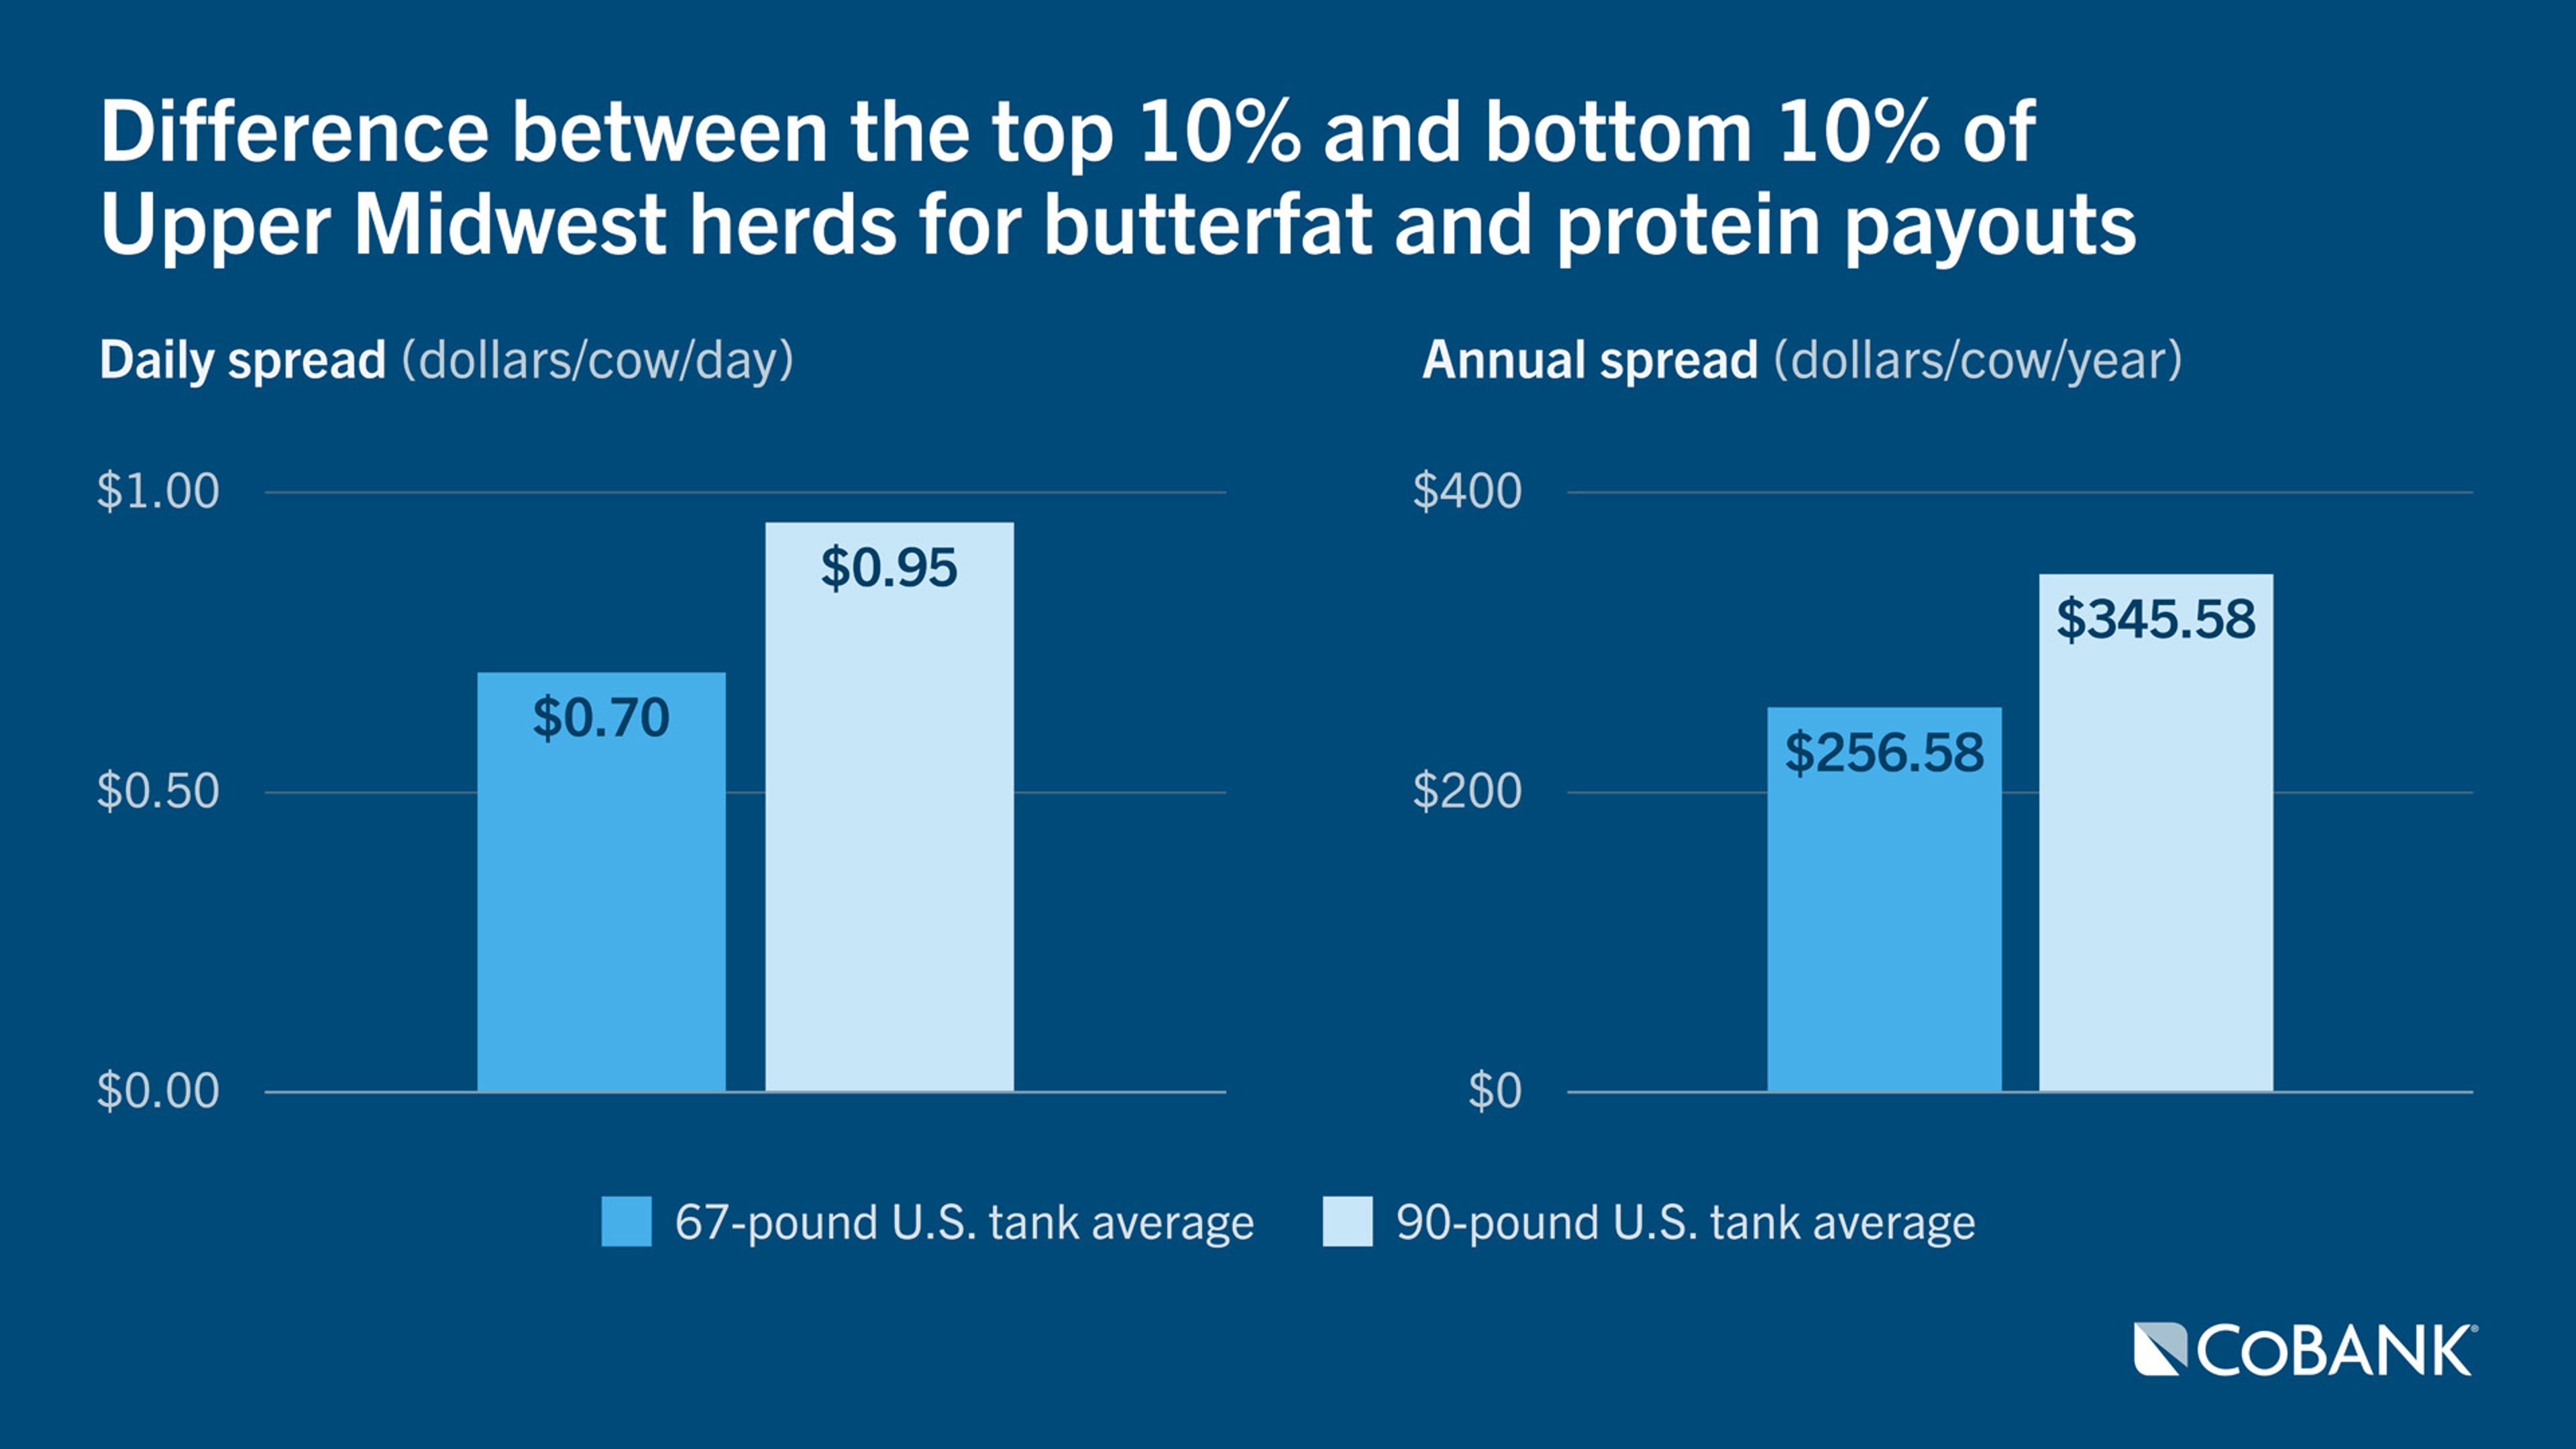
That yielded an advantage of 0.2 pounds of butterfat and 0.1 pounds of protein for the top decile herds. While that may seem like a small spread, applying last year’s federal order prices of $2.45 per pound of butterfat and $2.44 per pound of protein yields an additional $0.46 for the extra butterfat and $0.24 for the extra protein in the top decile group. Combined, higher-component herds held a $0.70 advantage per cow per day, provided milk volume held constant.
Of course, some herds are amplifying that opportunity. At a 90-pound tank average, equal to 33,000 pounds of milk per cow per year, the top Upper Midwest herds produced 4.0 pounds of butterfat and 3.0 pounds of protein, or 7.0 pounds of combined fat and protein. The lower group produced 3.7 pounds of butterfat and 2.9 pounds of protein, or 6.6 combined pounds. When applying prevailing butterfat and protein prices, the top group had a $0.95 advantage per cow per day.
On an annual basis, that advantage for high-component herds was $256.58 per cow over the lower-component herds. At the 90-pound tank average representing 33,000 pounds of milk per year, that advantage widened to $345.58 per cow per year. For a 100-cow dairy, that’s an extra $34,558 in income; $345,582 for a 1,000-cow dairy; and $3,455,820 for a 10,000-cow dairy.
A decade ago, top dairy herds would have been shipping 6 pounds of combined fat and protein at a 90-pound tank average. That number has now climbed to 7 pounds, reinforcing how quickly component production has become a more meaningful measure of milk check performance.
Order-level variation reveals revenue opportunities
Shifting consumer market demand and milk check incentives sparked a surge in milk’s butterfat and protein composition. After hovering from 3.65% to 3.69% from 1966 to 2010, butterfat began a steep climb, moving from 3.71% to 4.32% from 2011 to 2025, based on USDA-NASS data. That 0.61 percentage-point gain during the past 15 years is unmatched in U.S. dairy history.
While the gains in protein have not matched butterfat’s pace, they are certainly noteworthy. From 2011 to 2025, protein moved from 3.08% to 3.32%, posting an overall net gain of 0.24 percentage points, based on FMMO data.
National averages show the broad direction of the evolving market situation, but order-level data reveal where the largest revenue gaps are emerging. To better understand those dynamics, Brian Riordon from the Northeast Federal Milk Order 1 coordinated and fulfilled a CoBank data request for milk component levels from the seven FMMOs that price milk based on MCP provisions. The resulting dataset included 16,532 dairy herds, representing 70% of the 23,609 dairy herds with permits to sell milk in the United States in 2025. To ensure consistent comparisons, this analysis included only herds pooled in the order for the full year.

Butterfat levels for the Central, California and Mideast orders ranged from 4.21% to 4.29%, all below the 2025 national average of 4.32%. Meanwhile, the Southwest, Northeast, Upper Midwest and Pacific Northwest orders posted levels above the national butterfat average, ranging from 4.33% to 4.38%.
Those averages, however, do not show the full revenue opportunity. The spread between top- and bottom-decile herds within each order provides a clearer view of how component performance can change milk check outcomes.
The 2,939 herds in the Mideast FMMO showed the tightest butterfat window. Overall, the Mideast order averaged 4.29% butterfat. On the high end, the 293 herds in the top decile averaged 4.35% butterfat. In contrast, the 293 herds in the bottom decile averaged 4.24% butterfat.
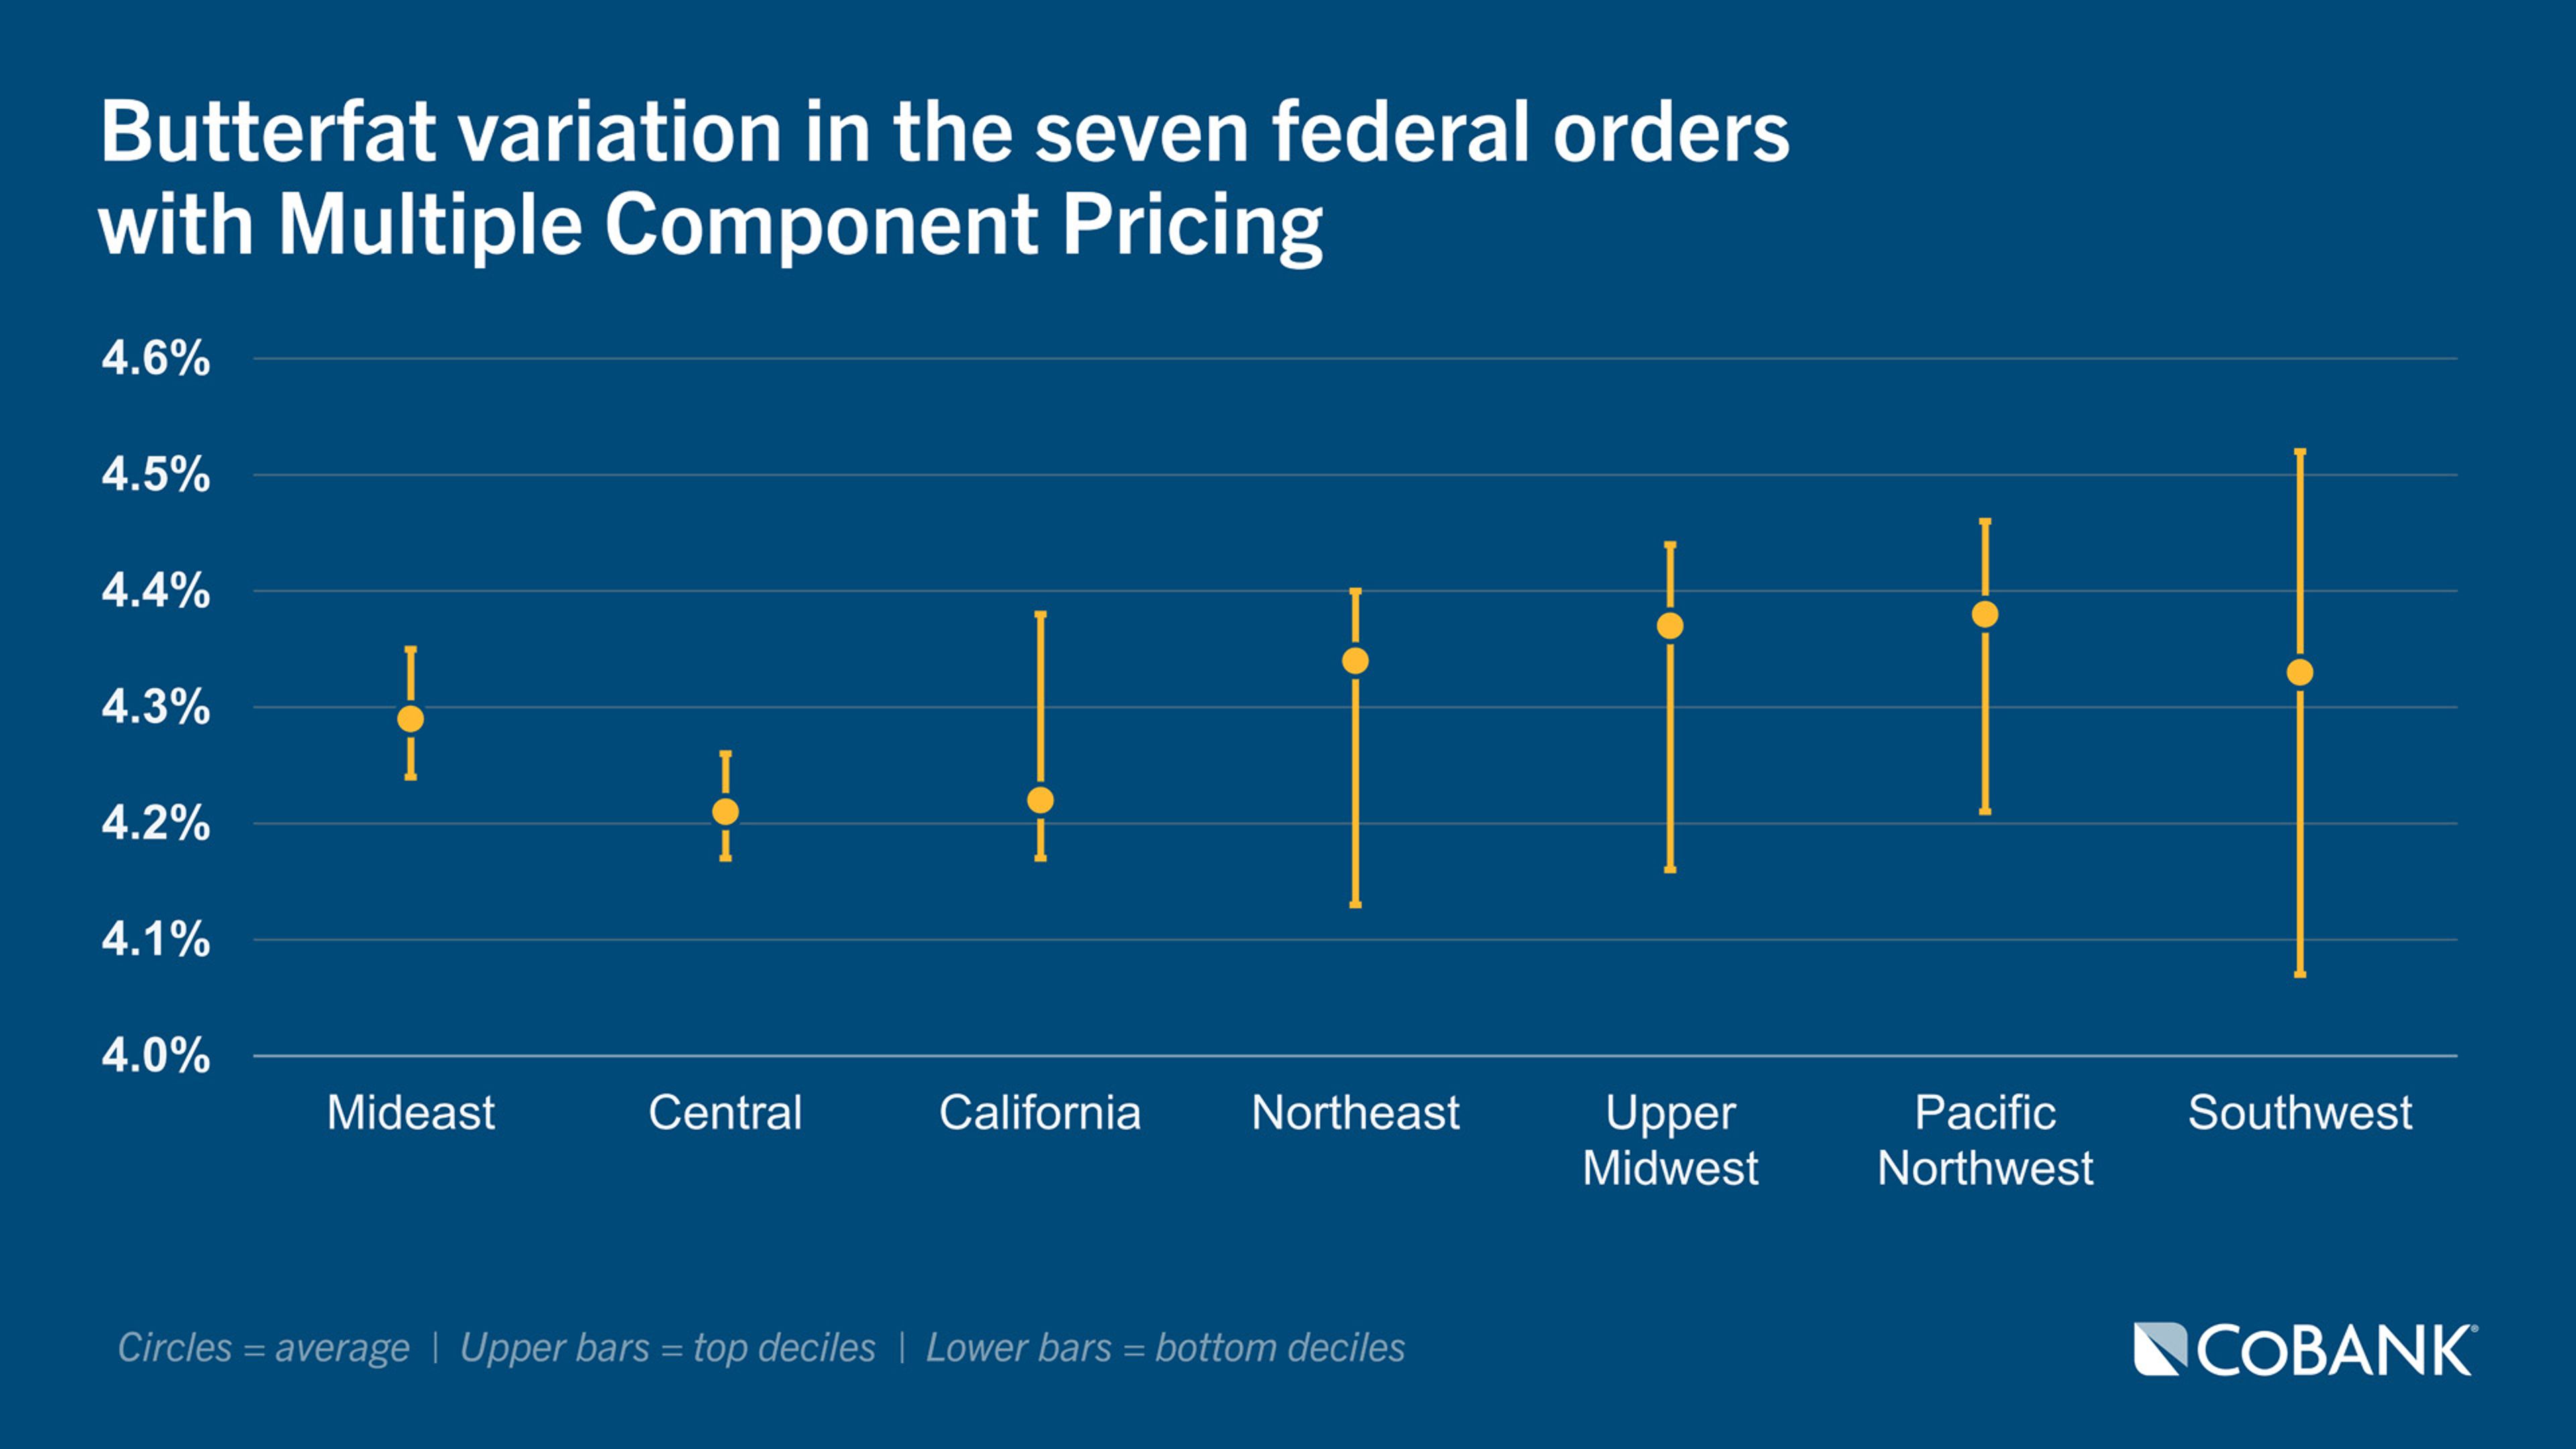
Meanwhile, the Southwest order, with its 172 herds, averaged 4.33% butterfat but showed the widest variation. The top decile averaged 4.52% butterfat, and the bottom 17 herds averaged 4.07% butterfat content. That’s a 0.45 percentage-point spread in butterfat content between the high and low herds.
Breed composition could explain some of this variation, as Jersey cattle generally produce higher butterfat and protein content than Holsteins. However, in larger orders such as the Upper Midwest and Northeast, with over 5,000 herds, there is far more at play. Holsteins represented over 85% of all bull semen sold last year, according to data from the National Association of Animal Breeders. Plus, the Holstein breed has experienced a tremendous shift in butterfat levels, moving from 3.66% in 2010 to 4.34% in 2025, based on data from Holstein Association USA.
As with butterfat, three FMMOs were below the national protein average, which is 3.32%. While the Mideast and Central orders appeared on both lists, California and the Northeast traded places. The three orders below the national protein average ranged from 3.27% to 3.29%. On the flip side, the Upper Midwest, California, Pacific Northwest and Southwest orders were above the national protein average, ranging from 3.33% to 3.42%.
Since butterfat and protein have a very strong genetic correlation, it’s not surprising that the Mideast also had the tightest variation in protein content. The Mideast averaged 3.28% protein. The 293 herds in the top decile averaged 3.32% protein and the bottom decile averaged 3.26% protein.
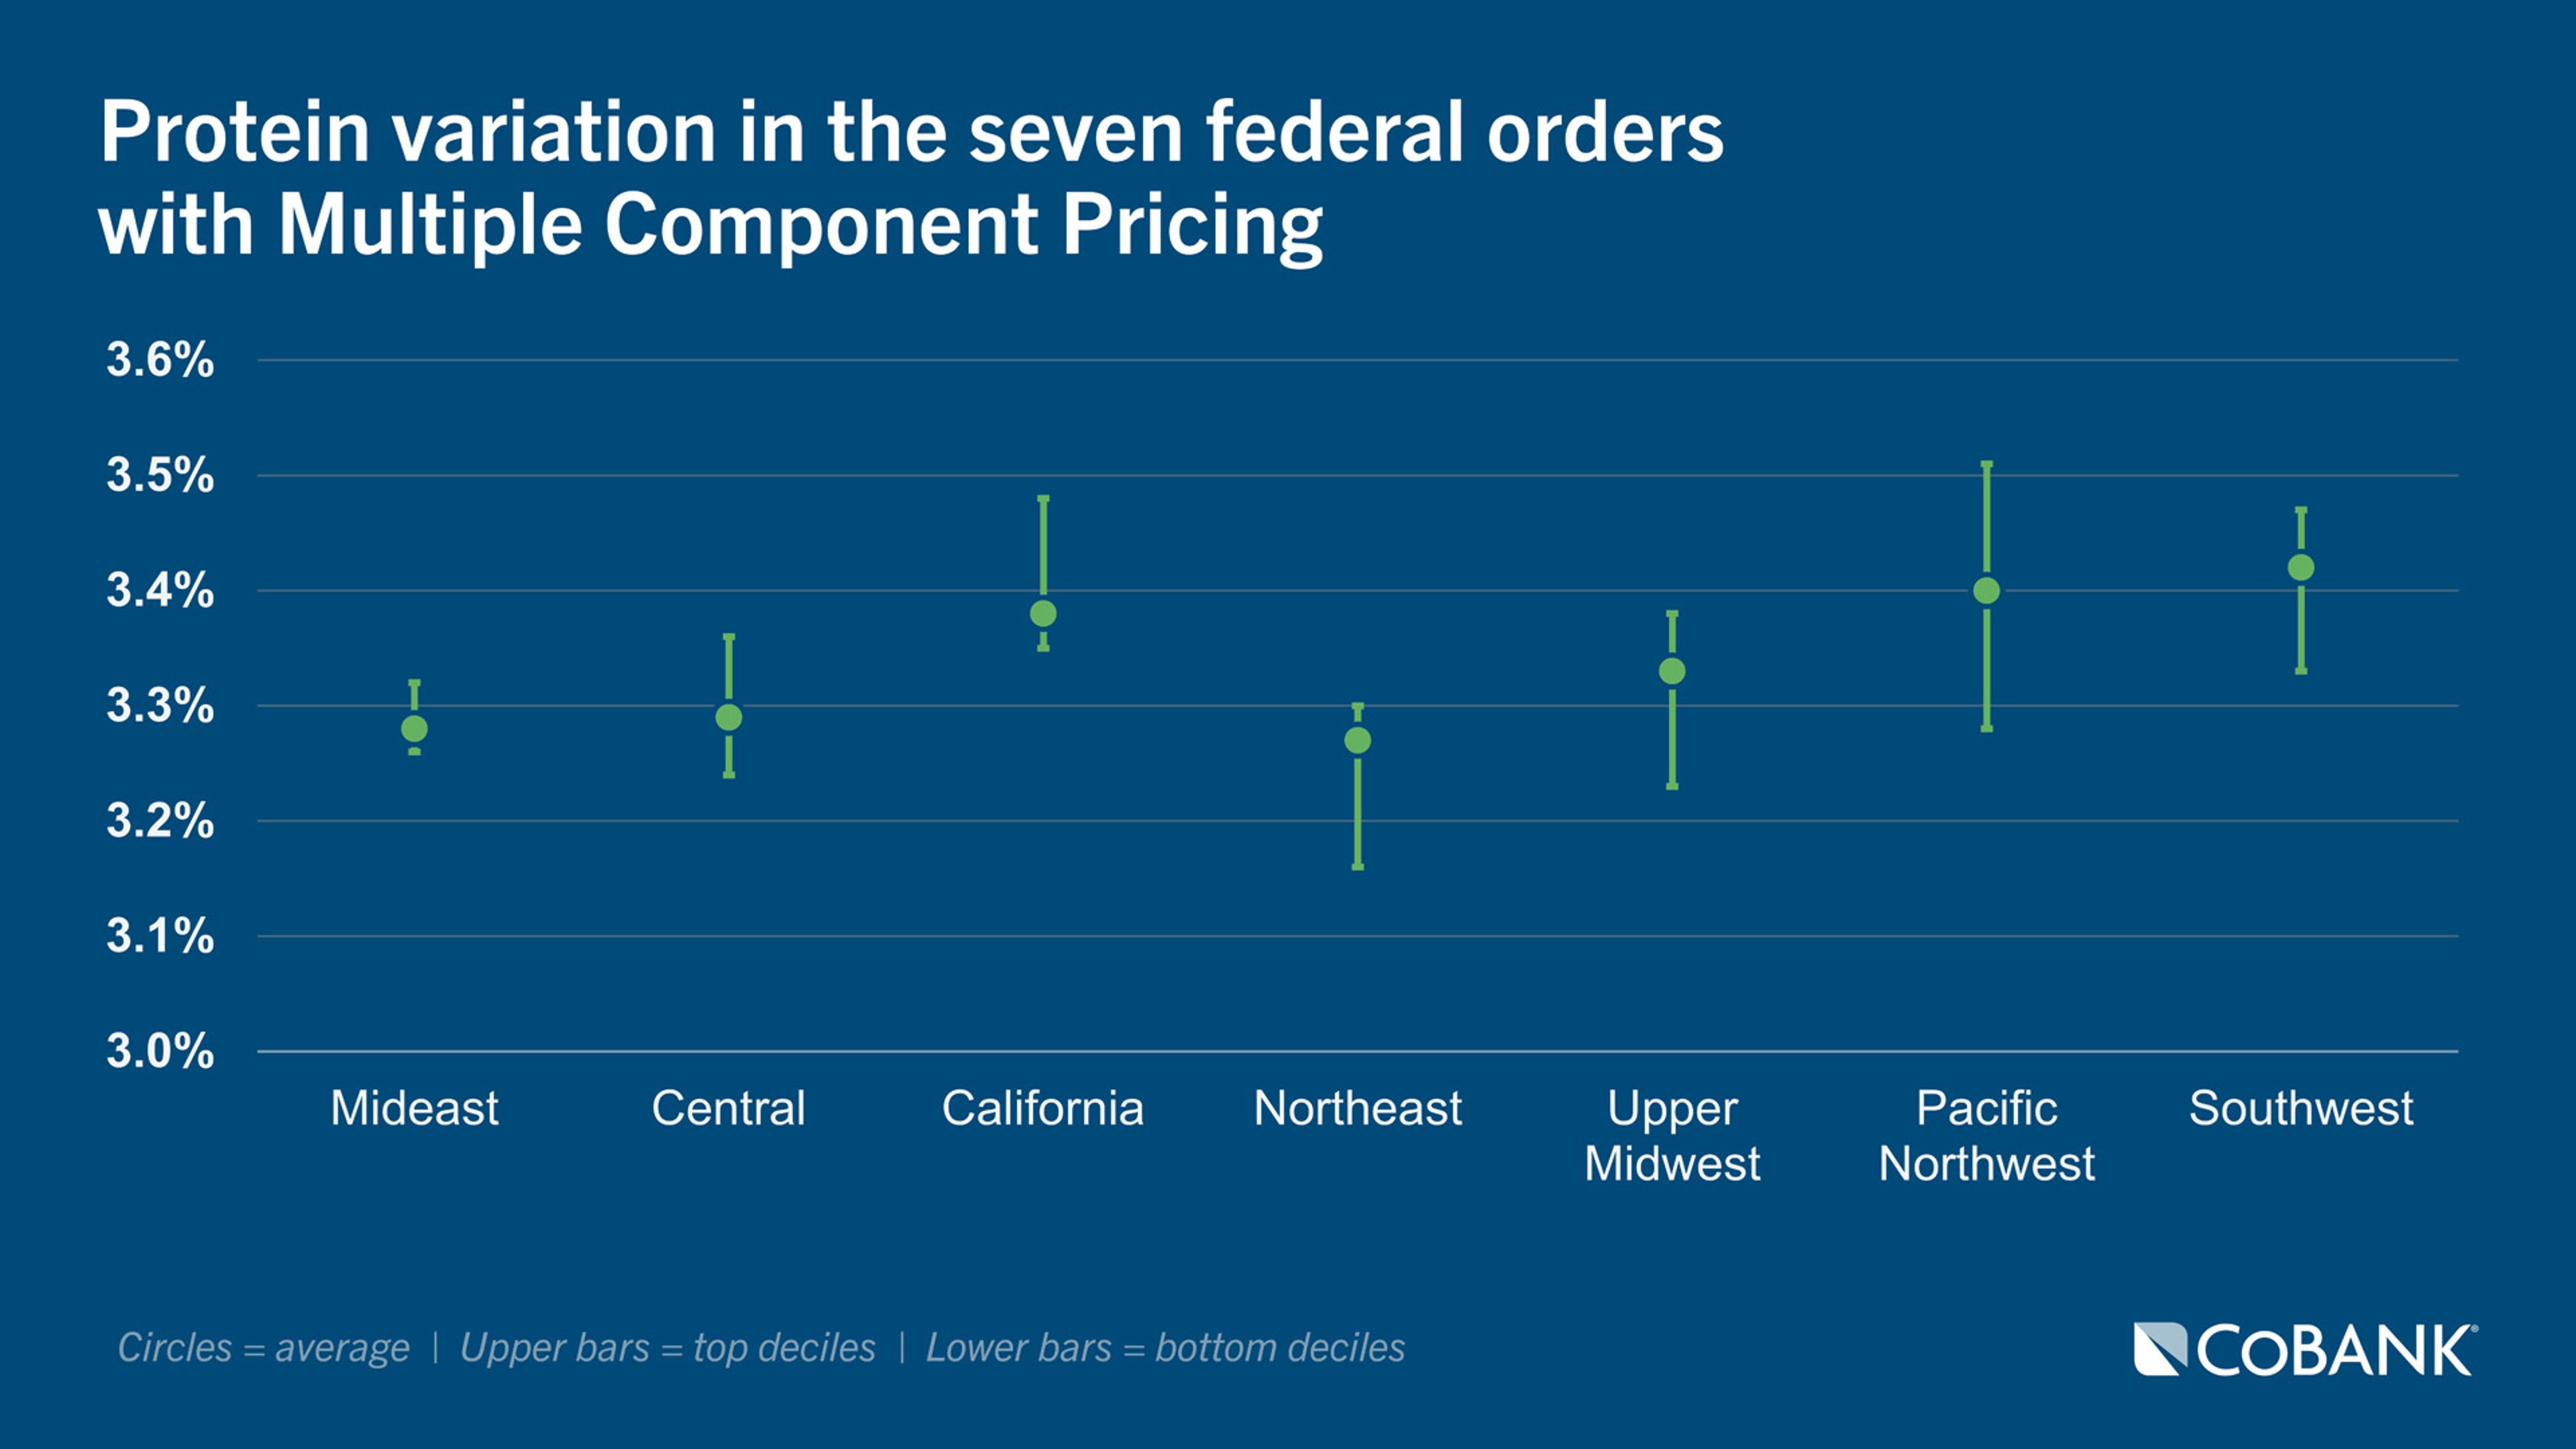
Averaging 3.40% protein, the Pacific Northwest showed the greatest variation in its 110 herds. The 11 herds in the top decile averaged 3.51% protein while the bottom decile averaged 3.28%. That’s a 0.23 percentage-point spread in milk protein content between the high and low herds.
As mentioned earlier, some of this variation could be attributed to breed composition. Just like butterfat, Holsteins’ protein percentages have improved from 3.00% to 3.25% from 2010 to 2025. Jerseys’ protein moved from 3.61% to 3.80% during that same period, according to data from the American Jersey Cattle Association.
Component gaps show how much money is at stake
The same variation that shows up in component percentages also shows up in producer revenue. Orders with tighter butterfat and protein ranges generate smaller milk check gaps, while orders with wider component variation create larger opportunities for high-component herds.
On the low-variation side of the analysis where butterfat and protein content held in a tighter range, the top decile in the Mideast order had a $0.28 per cow advantage over the lowest decile at average U.S. milk production. That advantage extended to $0.37 at a 90-pound tank average.
On the high-variation end of the FMMOs, the top-decile herds in the Southwest order had a $0.96 per cow advantage over the lowest decile herds with average U.S. milk production. That advantage pushed to $1.30 per cow at a 90-pound tank average.
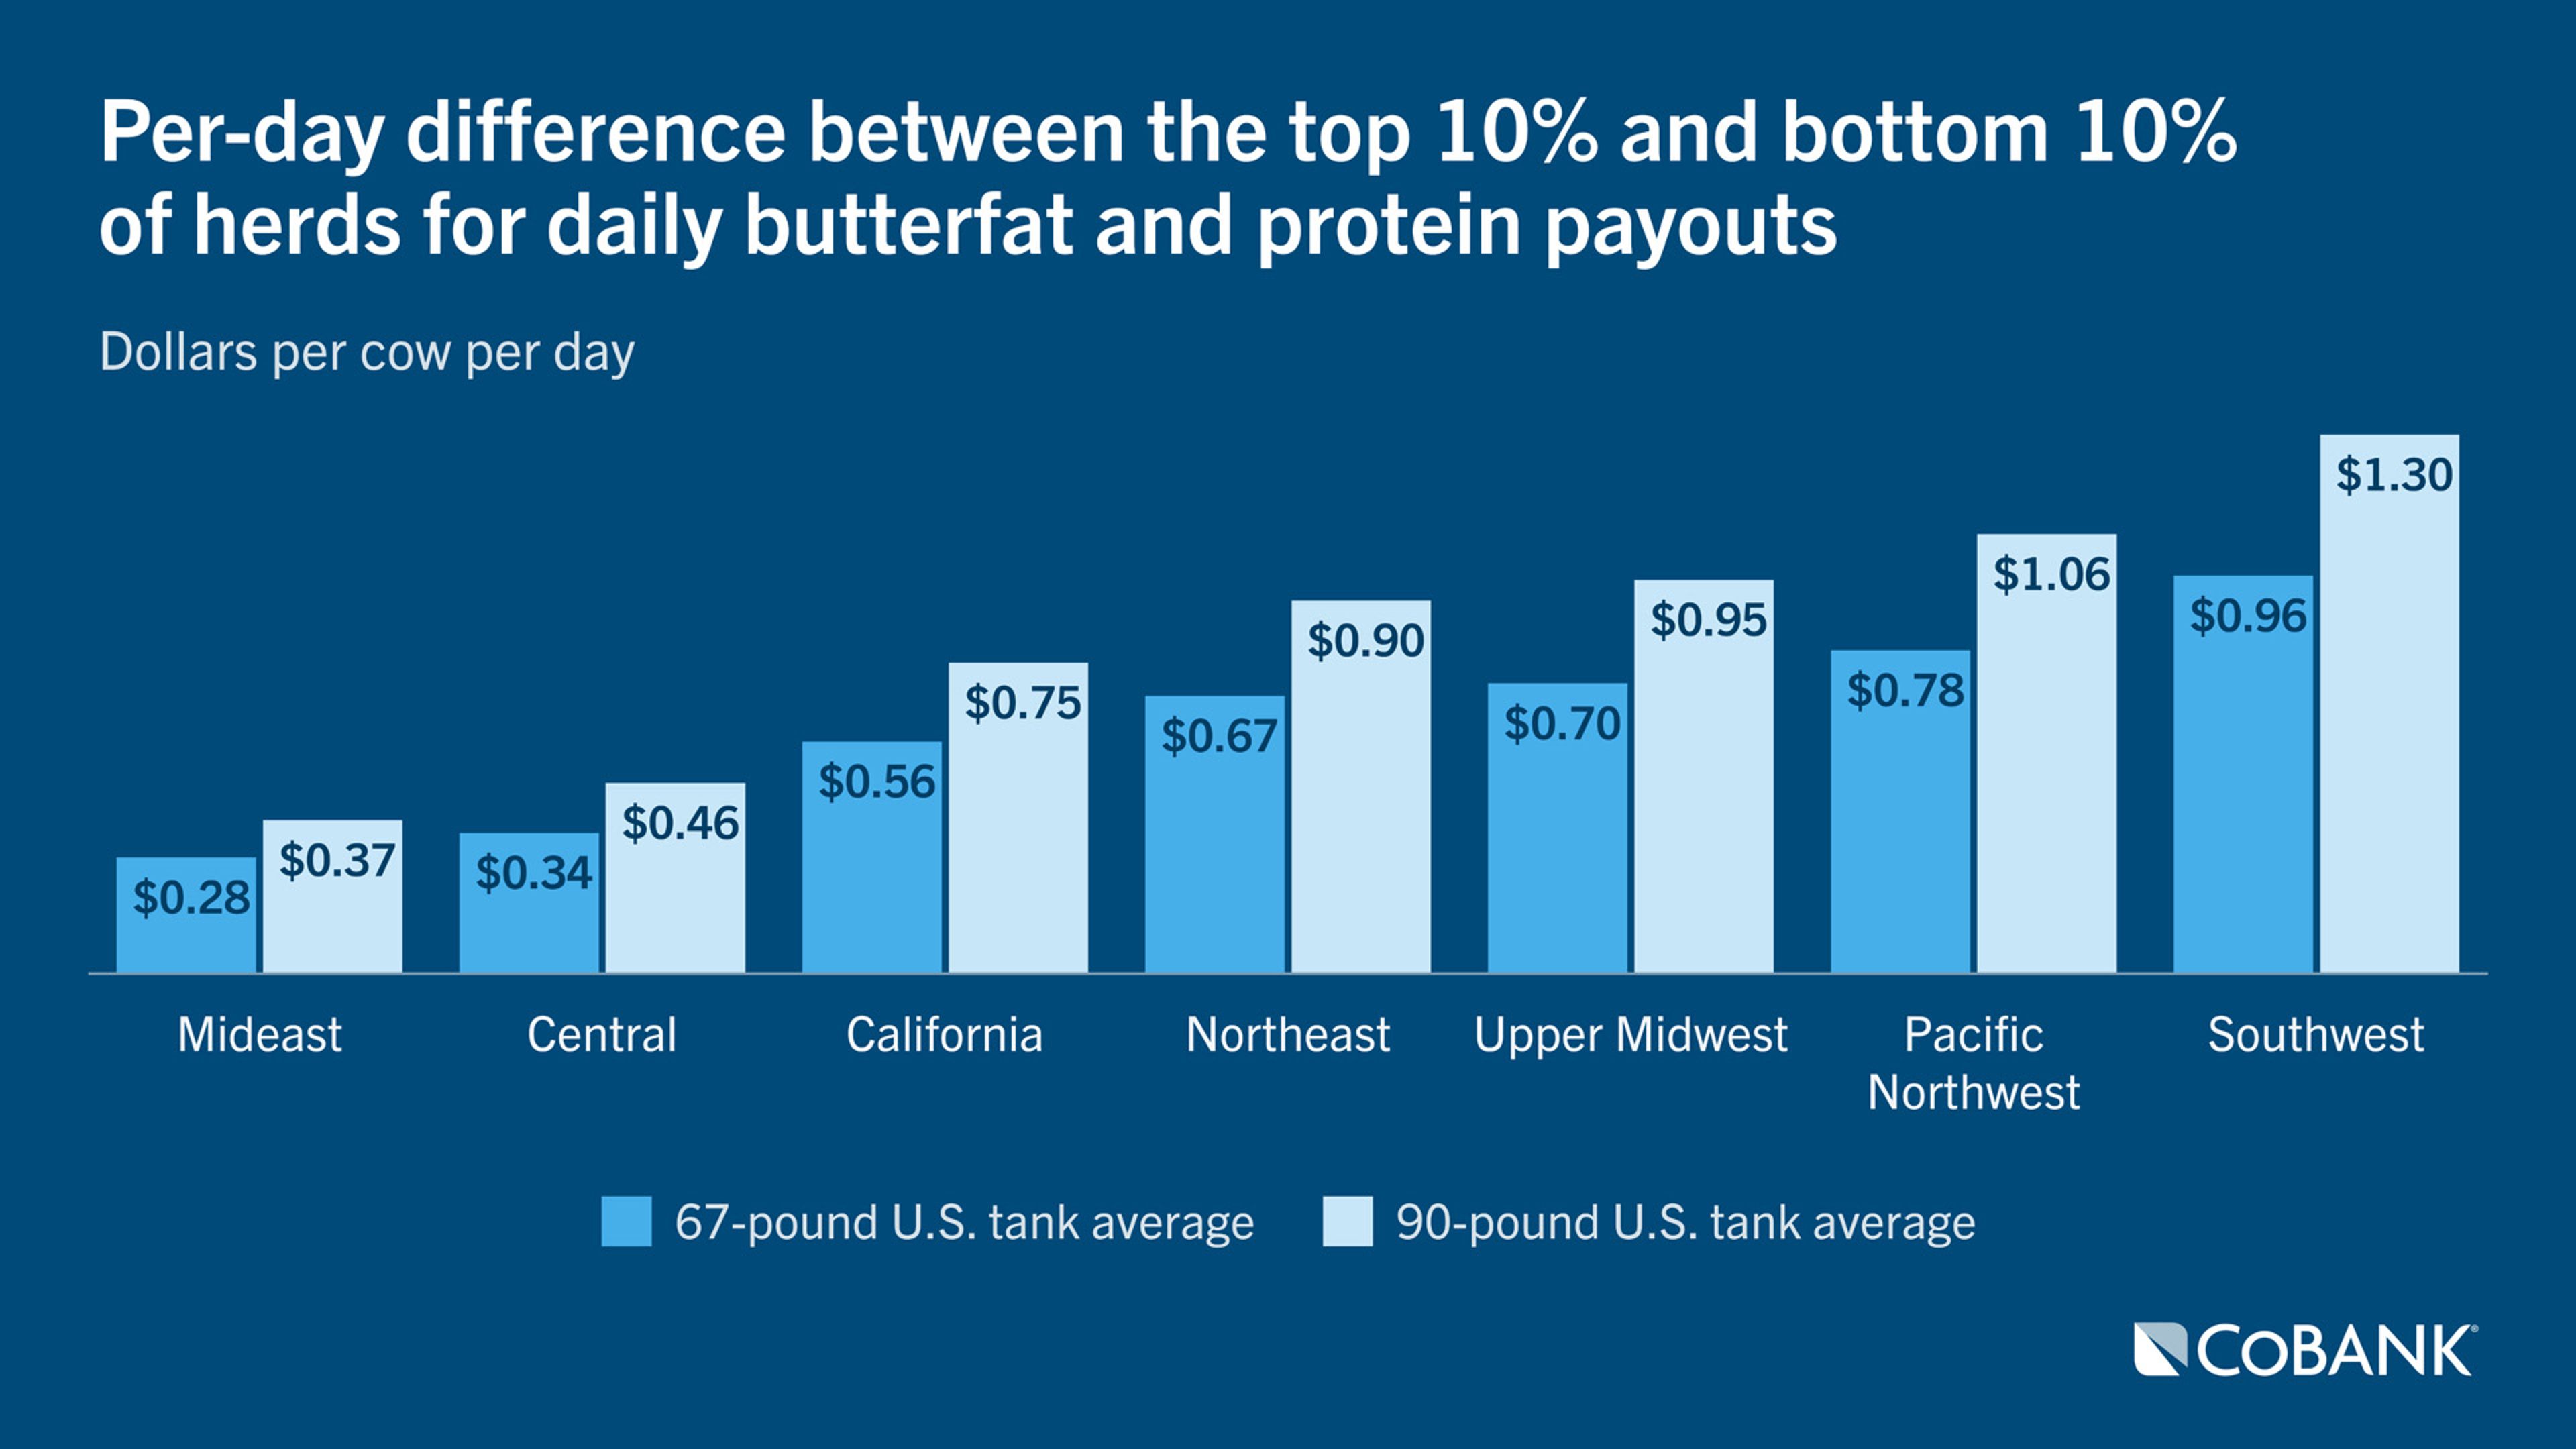
Mideast top decile herds had a $101.44 per cow advantage for the year over the lowest decile herds at average U.S. annual milk production of 24,390 pounds per cow. With a 33,000-pound herd average, that revenue advantage extended to $136.62 per cow.
Southwest top-decile herds netted $352.22 more per cow for the year at average U.S. milk production, and those gains jumped to $474.39 per cow at a 90-pound tank average with 33,000 pounds of annual milk production. For a 100-cow dairy, that’s an extra $47,439 in income; $474,390 for a 1,000-cow dairy; and $4,743,900 for a 10,000-cow dairy.
Higher components are reshaping dairy metrics
The opportunity to capture more revenue from milk component production continues to gain momentum. From 2000 to 2010, milk, butterfat and protein production measured by pounds grew at nearly the same pace, with gains ranging from 13.8% to 14.4%, based on calculations using USDA-NASS and FMMO data. Everything changed in the ensuing 15 years: Milk production grew just 18.4% while protein pounds jumped 27.7% and butterfat pounds climbed by 34.6%, with the strongest growth coming in the most recent years.
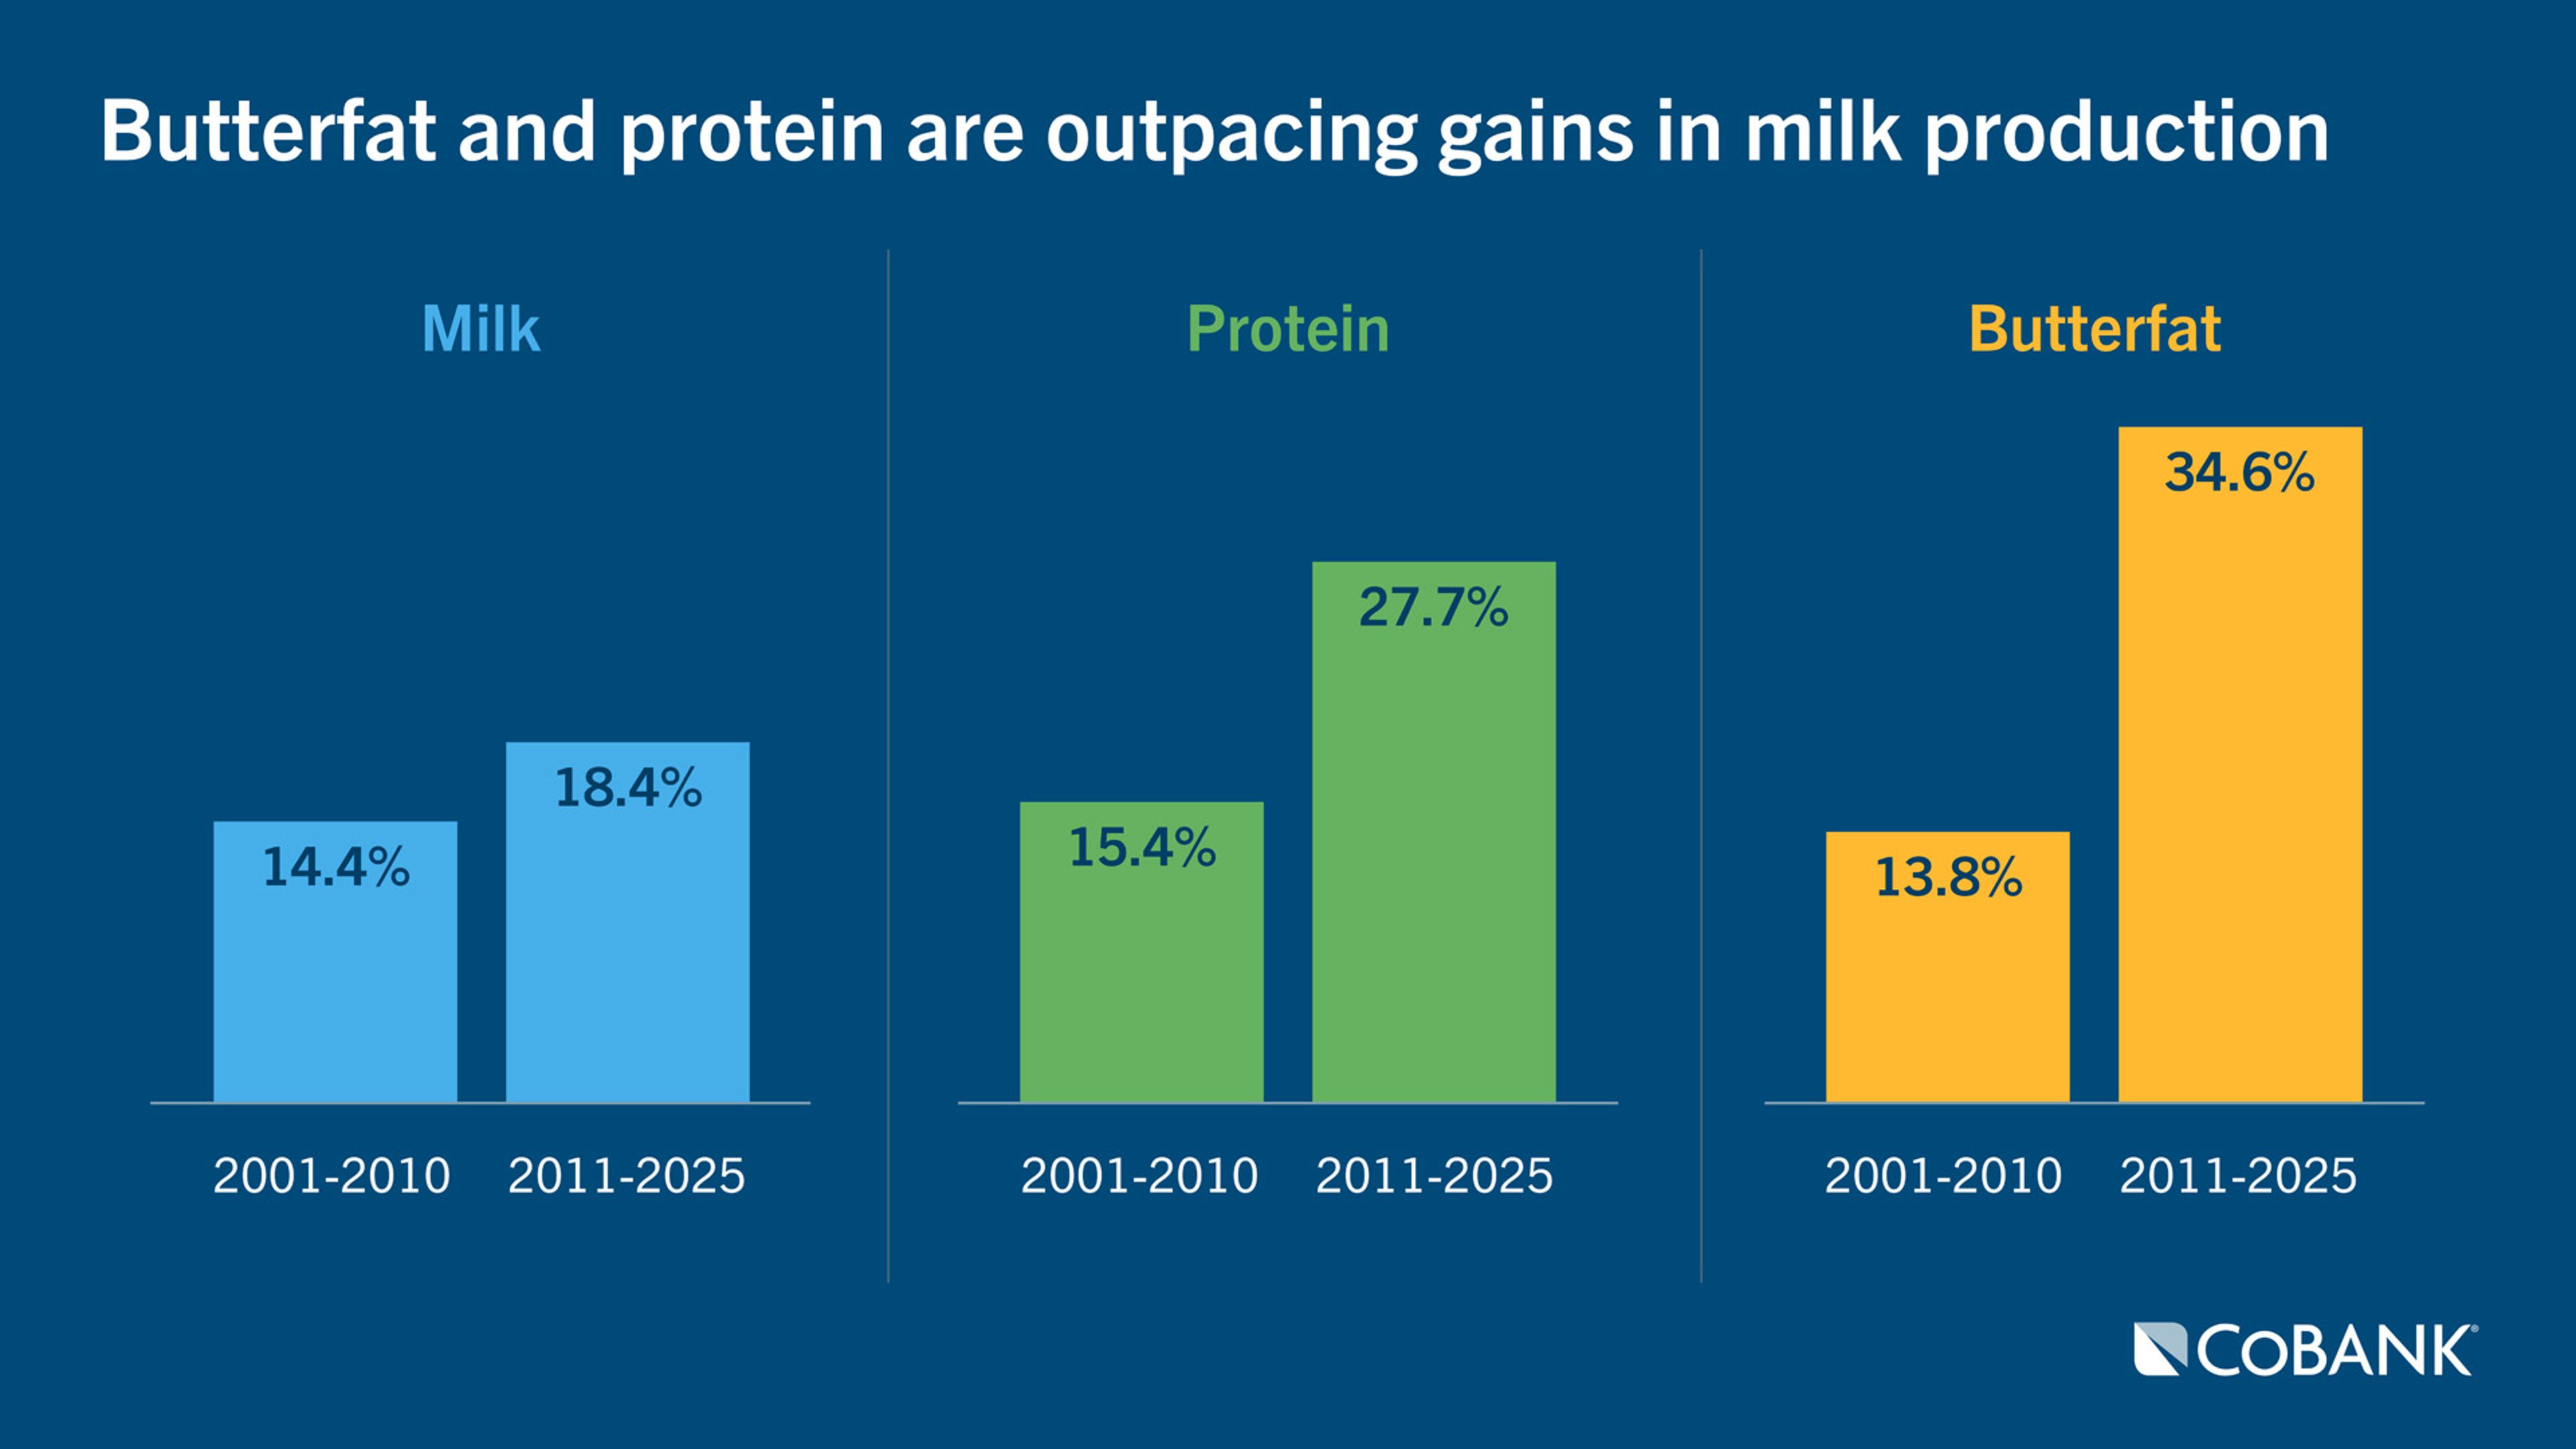
Growth in milk components gives dairy producers another path to higher milk checks. It also gives dairy processors an opportunity to further incentivize the components their plants need the most. Federal order pricing formulas do not fully factor in the growing protein demand and its resulting marketplace revenue. Some processors are already finding ways to include product prices such as whey protein concentrate and whey protein isolate in milk check formulas. These newer pricing concepts, above and beyond federal order minimums, further incentivize protein production.
Those opportunities are likely to keep expanding as component production becomes a more important measure of farm performance. This analysis indicates that once-revered metrics such as the rolling herd average for milk production should have a tombstone that reads, “Rest in Peace.” This especially holds true for every farm that has milk priced via Multiple Component Pricing that determines milk check revenue.
The new era of farm metrics should give more weight to rolling herd average for components or simply pounds of components, because that number ultimately drives revenue. At a 90-pound tank average, the top decile herds in the Upper Midwest FMMO are already averaging 7 pounds of combined butterfat and protein per day. The very top herds have pushed past 8 pounds daily, generating even more revenue per cow. Given the current trajectory, the U.S. is well on its way to averaging 5.0% butterfat and 4.0% protein before 2035. If those projections seem far-fetched, consider the fact that New Zealand milk already averages components above those levels.
The authors would like to thank external reviewers including Areerat Kichkha, Brian Riordon and Nate Zwald.
Disclaimer: The information provided in this report is not intended to be investment, tax, or legal advice and should not be relied upon by recipients for such purposes. The information contained in this report has been compiled from what CoBank regards as reliable sources. However, CoBank does not make any representation or warranty regarding the content, and disclaims any responsibility for the information, materials, third-party opinions, and data included in this report. In no event will CoBank be liable for any decision made or actions taken by any person or persons relying on the information contained in this report.