
The U.S. butterfat boom has become a double-edged sword


Key points
- U.S. butterfat content in cow’s milk has climbed by 15.2% over the past decade, nearly five times the growth rate of New Zealand and the EU.
- This U.S. butterfat boom has become a double-edged sword, as butterfat has outpaced protein growth and created new market challenges.
- The falling protein-to-fat ratio is a problem for U.S. cheese makers, which makes it a problem for the dairy industry as up to half of all U.S. milk on a total solids basis goes to cheese vats.
- As domestic demand alone can no longer absorb the growing supply of butterfat, the U.S. dairy sector will need stronger international outlets — a challenge that export competitors do not have.
- Higher protein prices and updated genetic incentives are pushing the industry toward more protein, but meaningful changes in herd genetics and milk composition will require sustained effort.
U.S. milk components are growing, but they are growing out of balance. Since we last examined the global components landscape last year, U.S. butterfat has surged faster than protein, creating a mismatch between what the milk supply is producing and what cheese makers and other dairy processors increasingly need. However, while major export competitors New Zealand and the EU have grown their butterfat and protein percentages, they have done so with consistent ratios.
For dairy farmers and processors alike, the two most economically important milk components are butterfat and protein. These milk solids are foundational to the most widely traded dairy products and ingredients such as cheese, butter, whey and milk powders.
The growth in milk component production is an essential driver for dairy farmers’ milk checks, dairy processors’ product yields and output, domestic sales, and ultimately, global trade. This report examines what’s changed on the international scene since our 2025 report, While U.S. leads milk component growth, butterfat may be growing too fast.
Butterfat continues to boom
The U.S. is not simply producing more butterfat because it has more milk. It is changing the composition of the milk itself, and that shift sets it apart from other major exporters.
Genetics, genomics, breed composition, forages and feed ingredients all play pivotal roles in butterfat production. New Zealand’s breed composition and feeding programs have set the global pace in milk’s butterfat content, with levels rising from 5.02% in 2015 to 5.20% in 2025, according to data from Dairy NZ and LIC. The EU moved more modestly, from 4.03% butterfat to 4.16% over the same decade. The U.S. posted the largest gain among the leading global dairy exporters, rising from 3.75% to 4.32%, based on data from USDA-NASS. Canada is not a major dairy exporter, but its improvement mirrored the U.S. because North America has similar dairy cattle genetics. Canadian butterfat levels rose from 4.07% to 4.39% over the past decade.
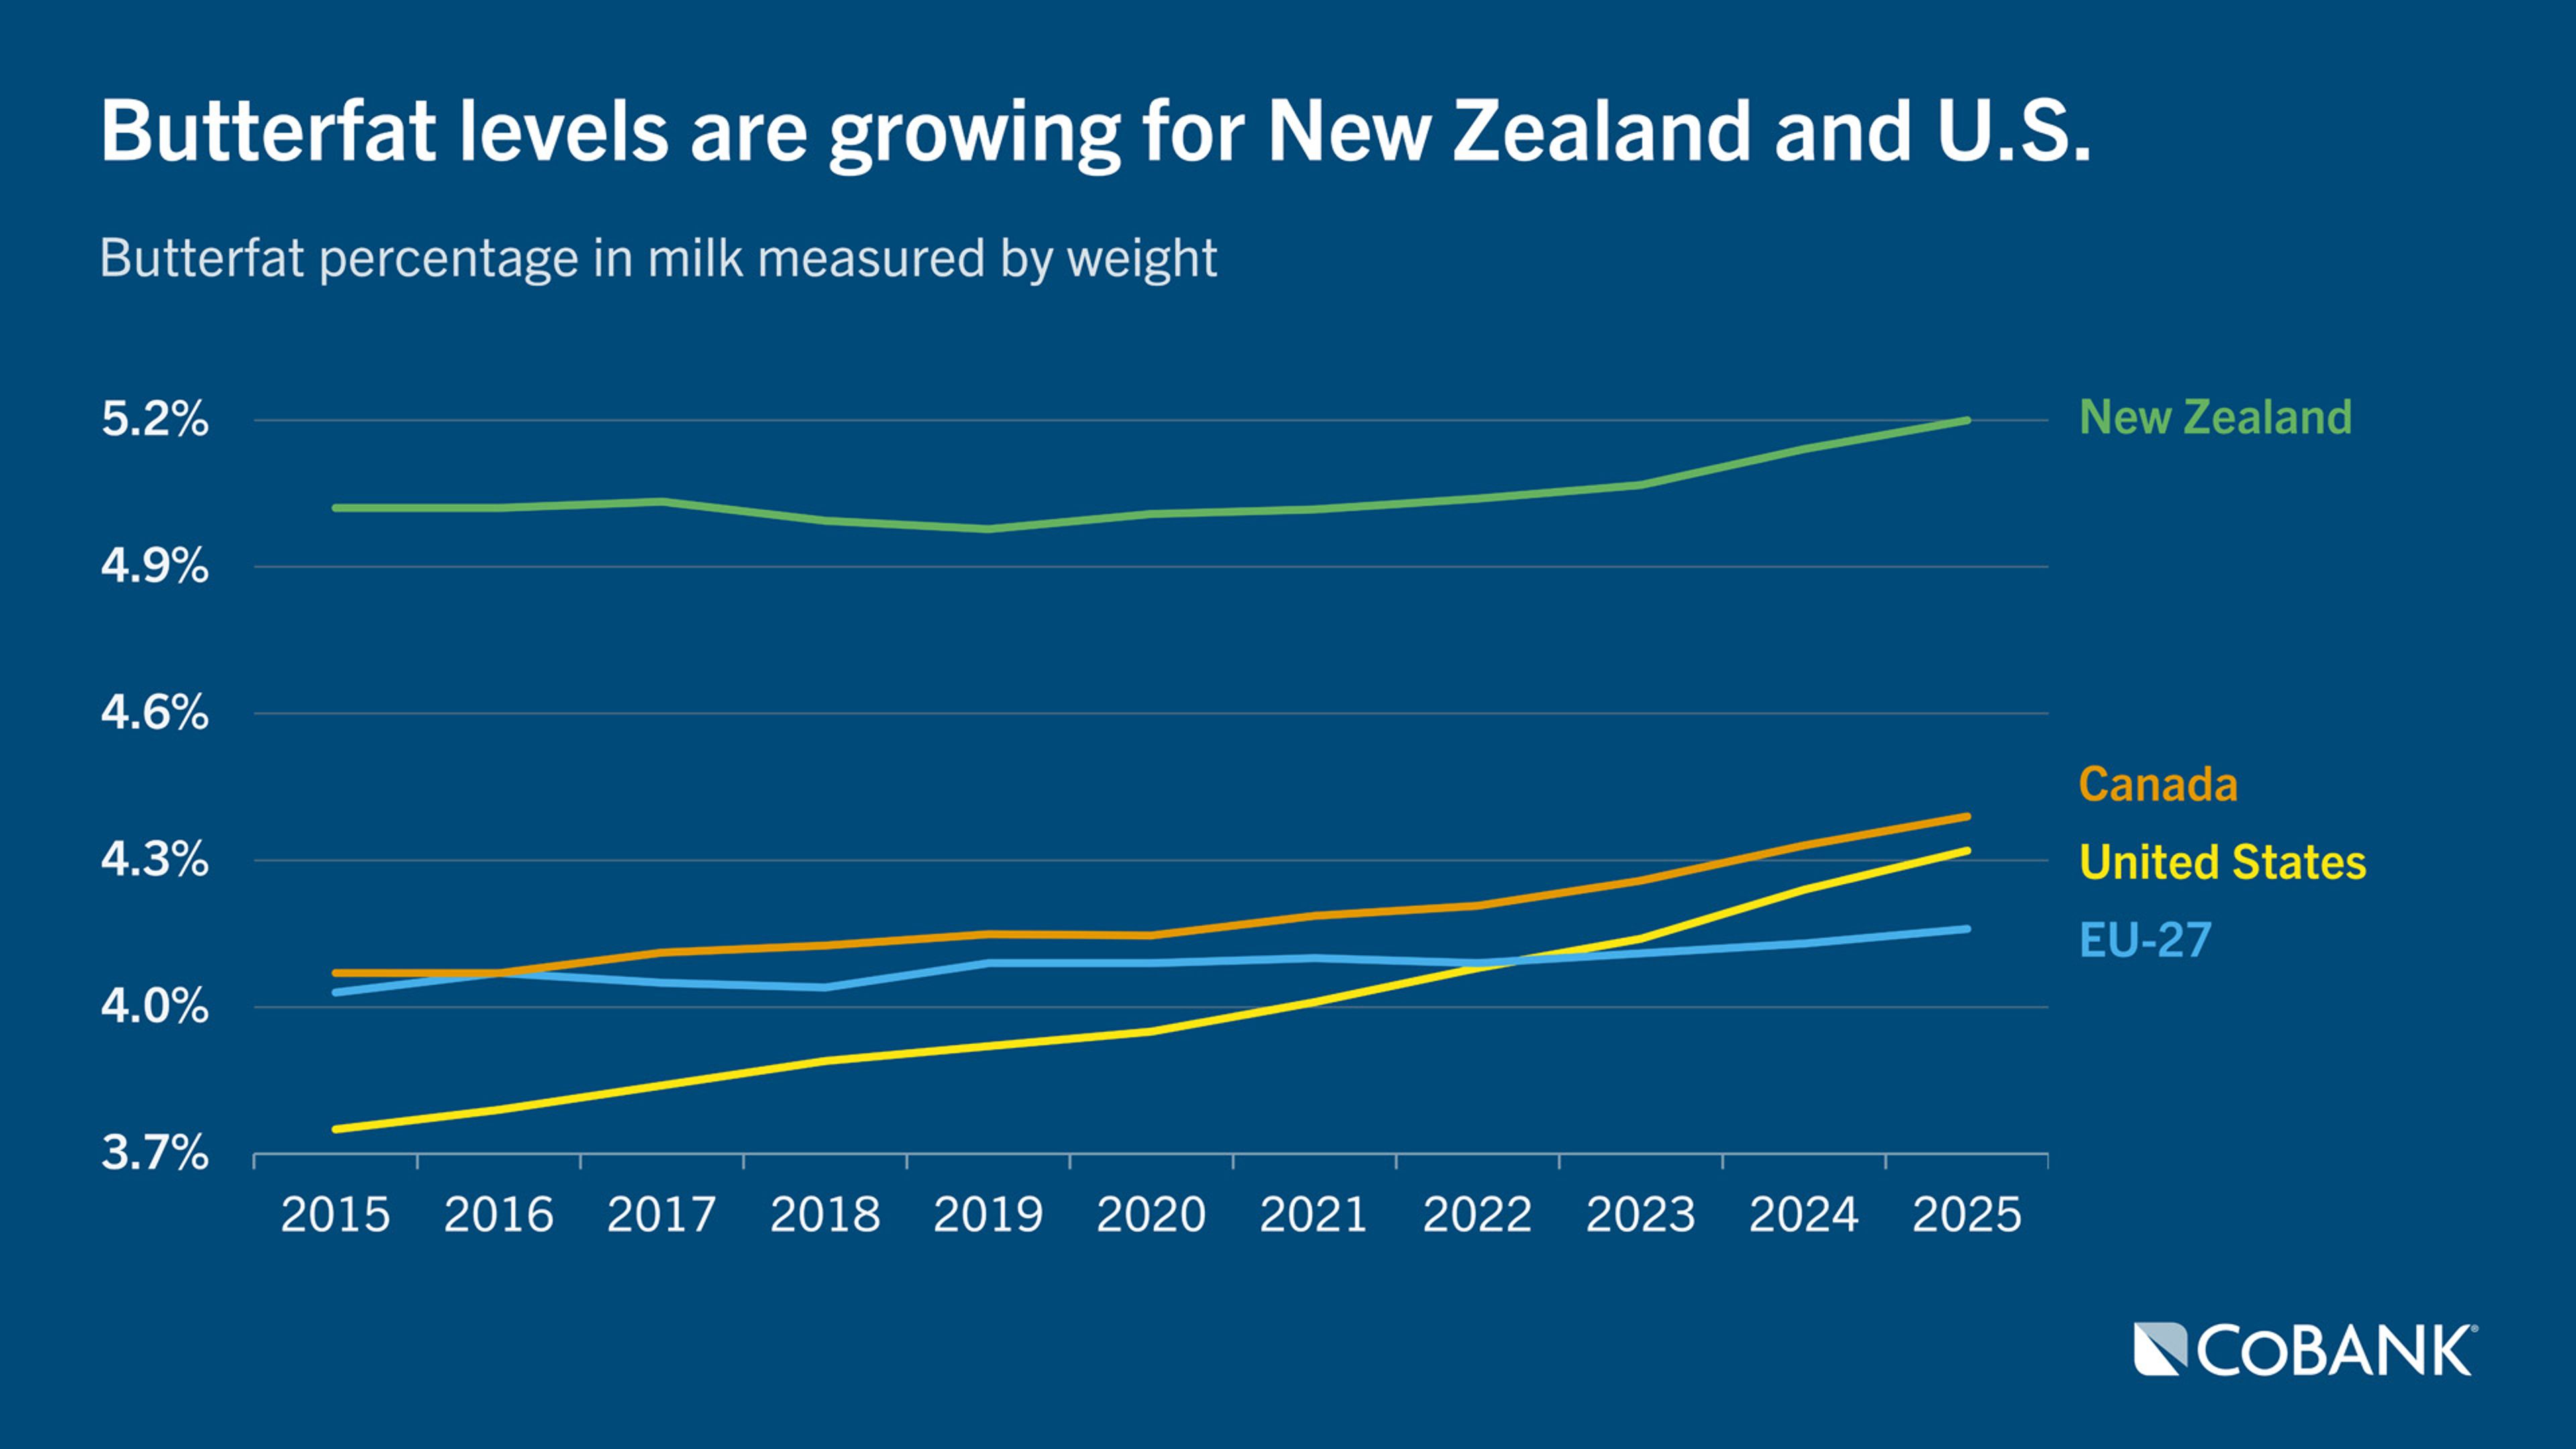
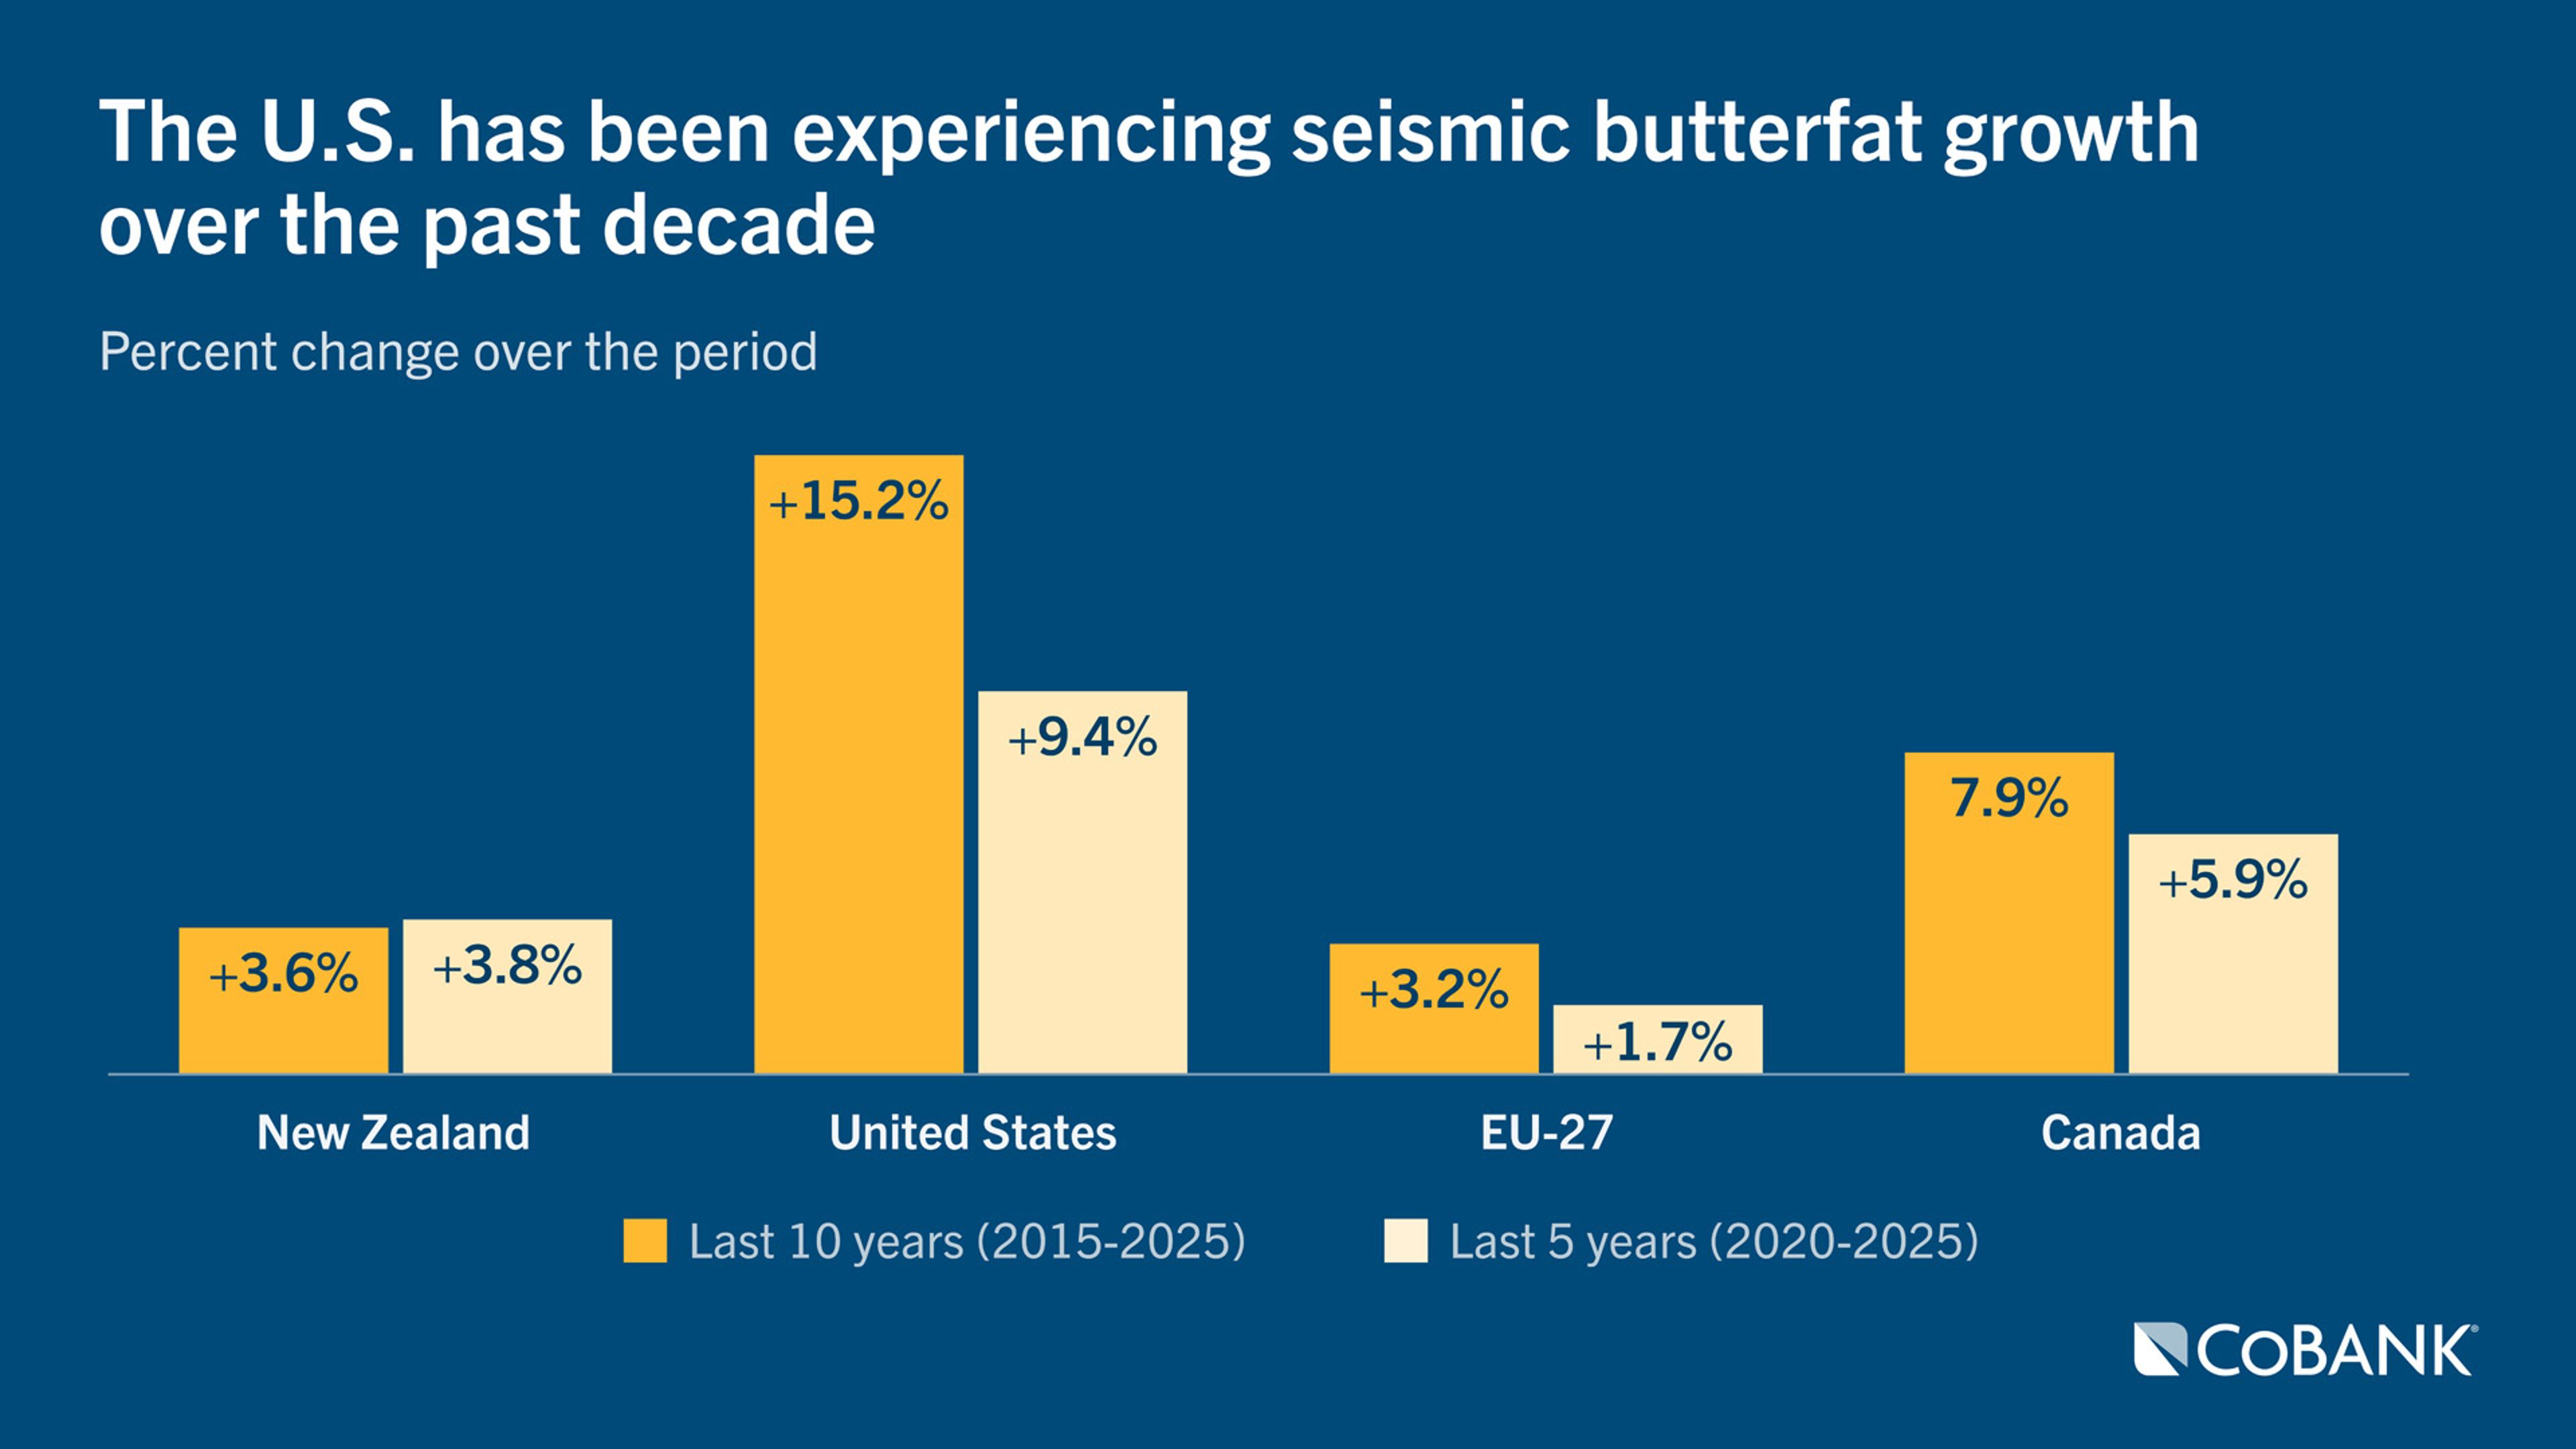
Pounds matter to processors, but butterfat percentage offers a cleaner comparison because it adjusts for differences in milk volume. By that measure, the U.S. has easily outpaced major dairy exporters, increasing butterfat content in cow’s milk by 15.2% over the past decade. The pace has accelerated recently: Nearly two-thirds of that growth occurred in the past five years with the U.S. growing butterfat by 9.4%.
Among the two other major players, New Zealand grew butterfat production by 3.6% over the past decade, while the EU rose 3.2%. Canada grew 7.9%, with three-quarters of that gain taking place from 2020 to 2025.
But the butterfat story has a catch. Cheese makers do not buy butterfat and protein in isolation; they need the right balance between the two. That is where the U.S. advantage begins to look more complicated.
Protein shows slower growth
Global consumer demand for protein across the globe is at a generational high, but boosting the protein content in cow’s milk has proven to be more difficult than raising butterfat levels. Beyond genetics, dairy farmers have fewer economically viable tools to improve protein content. Genetics accounts for 62% of the contemporary butterfat gains and 72% of protein gains, according to data from the Council on Dairy Cattle Breeding. Butterfat and protein also have an 80% genetic correlation, meaning butterfat trends will continue to some extent even if dairy farmers reduce genetic selection for that trait.
That genetic relationship helps explain the slower movement in protein. From 2015 to 2025, protein levels rose from 3.87% to 4.02% in New Zealand and from 3.36% to 3.48% in Europe, based on CLAL and Eurostat data. The U.S. moved from 3.11% to 3.34%, and Canada nearly mirrored that shift.
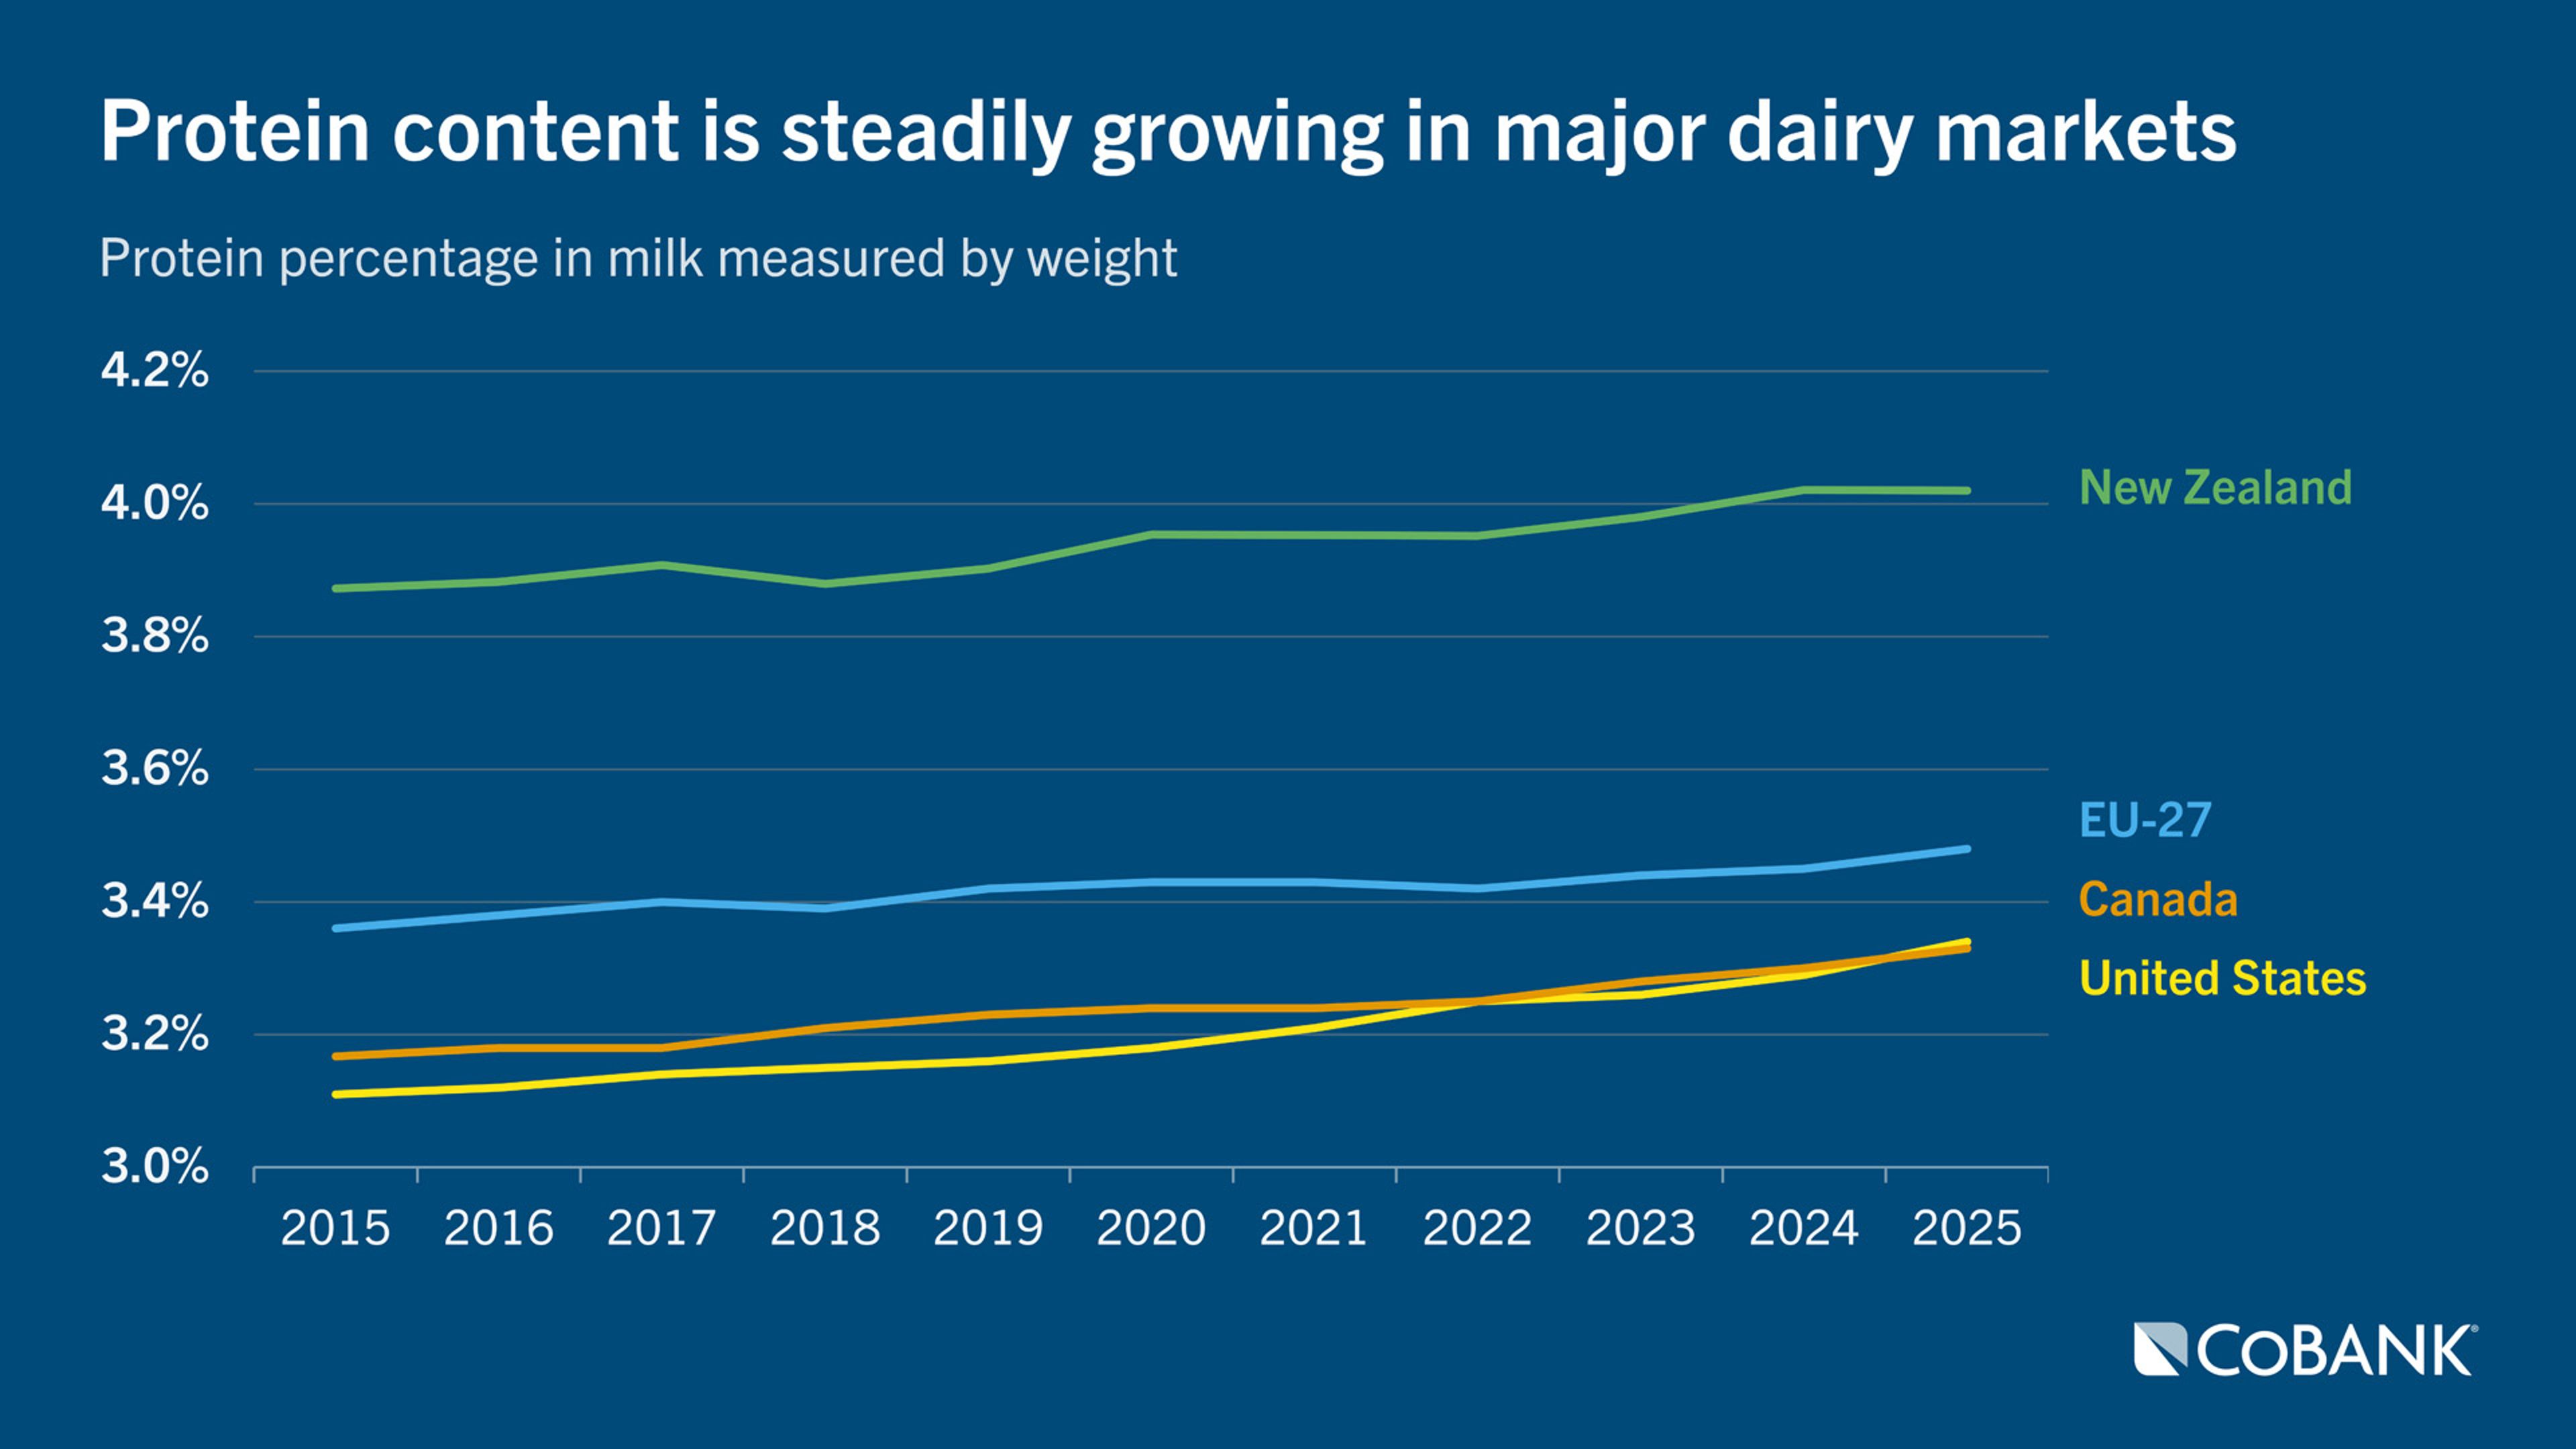
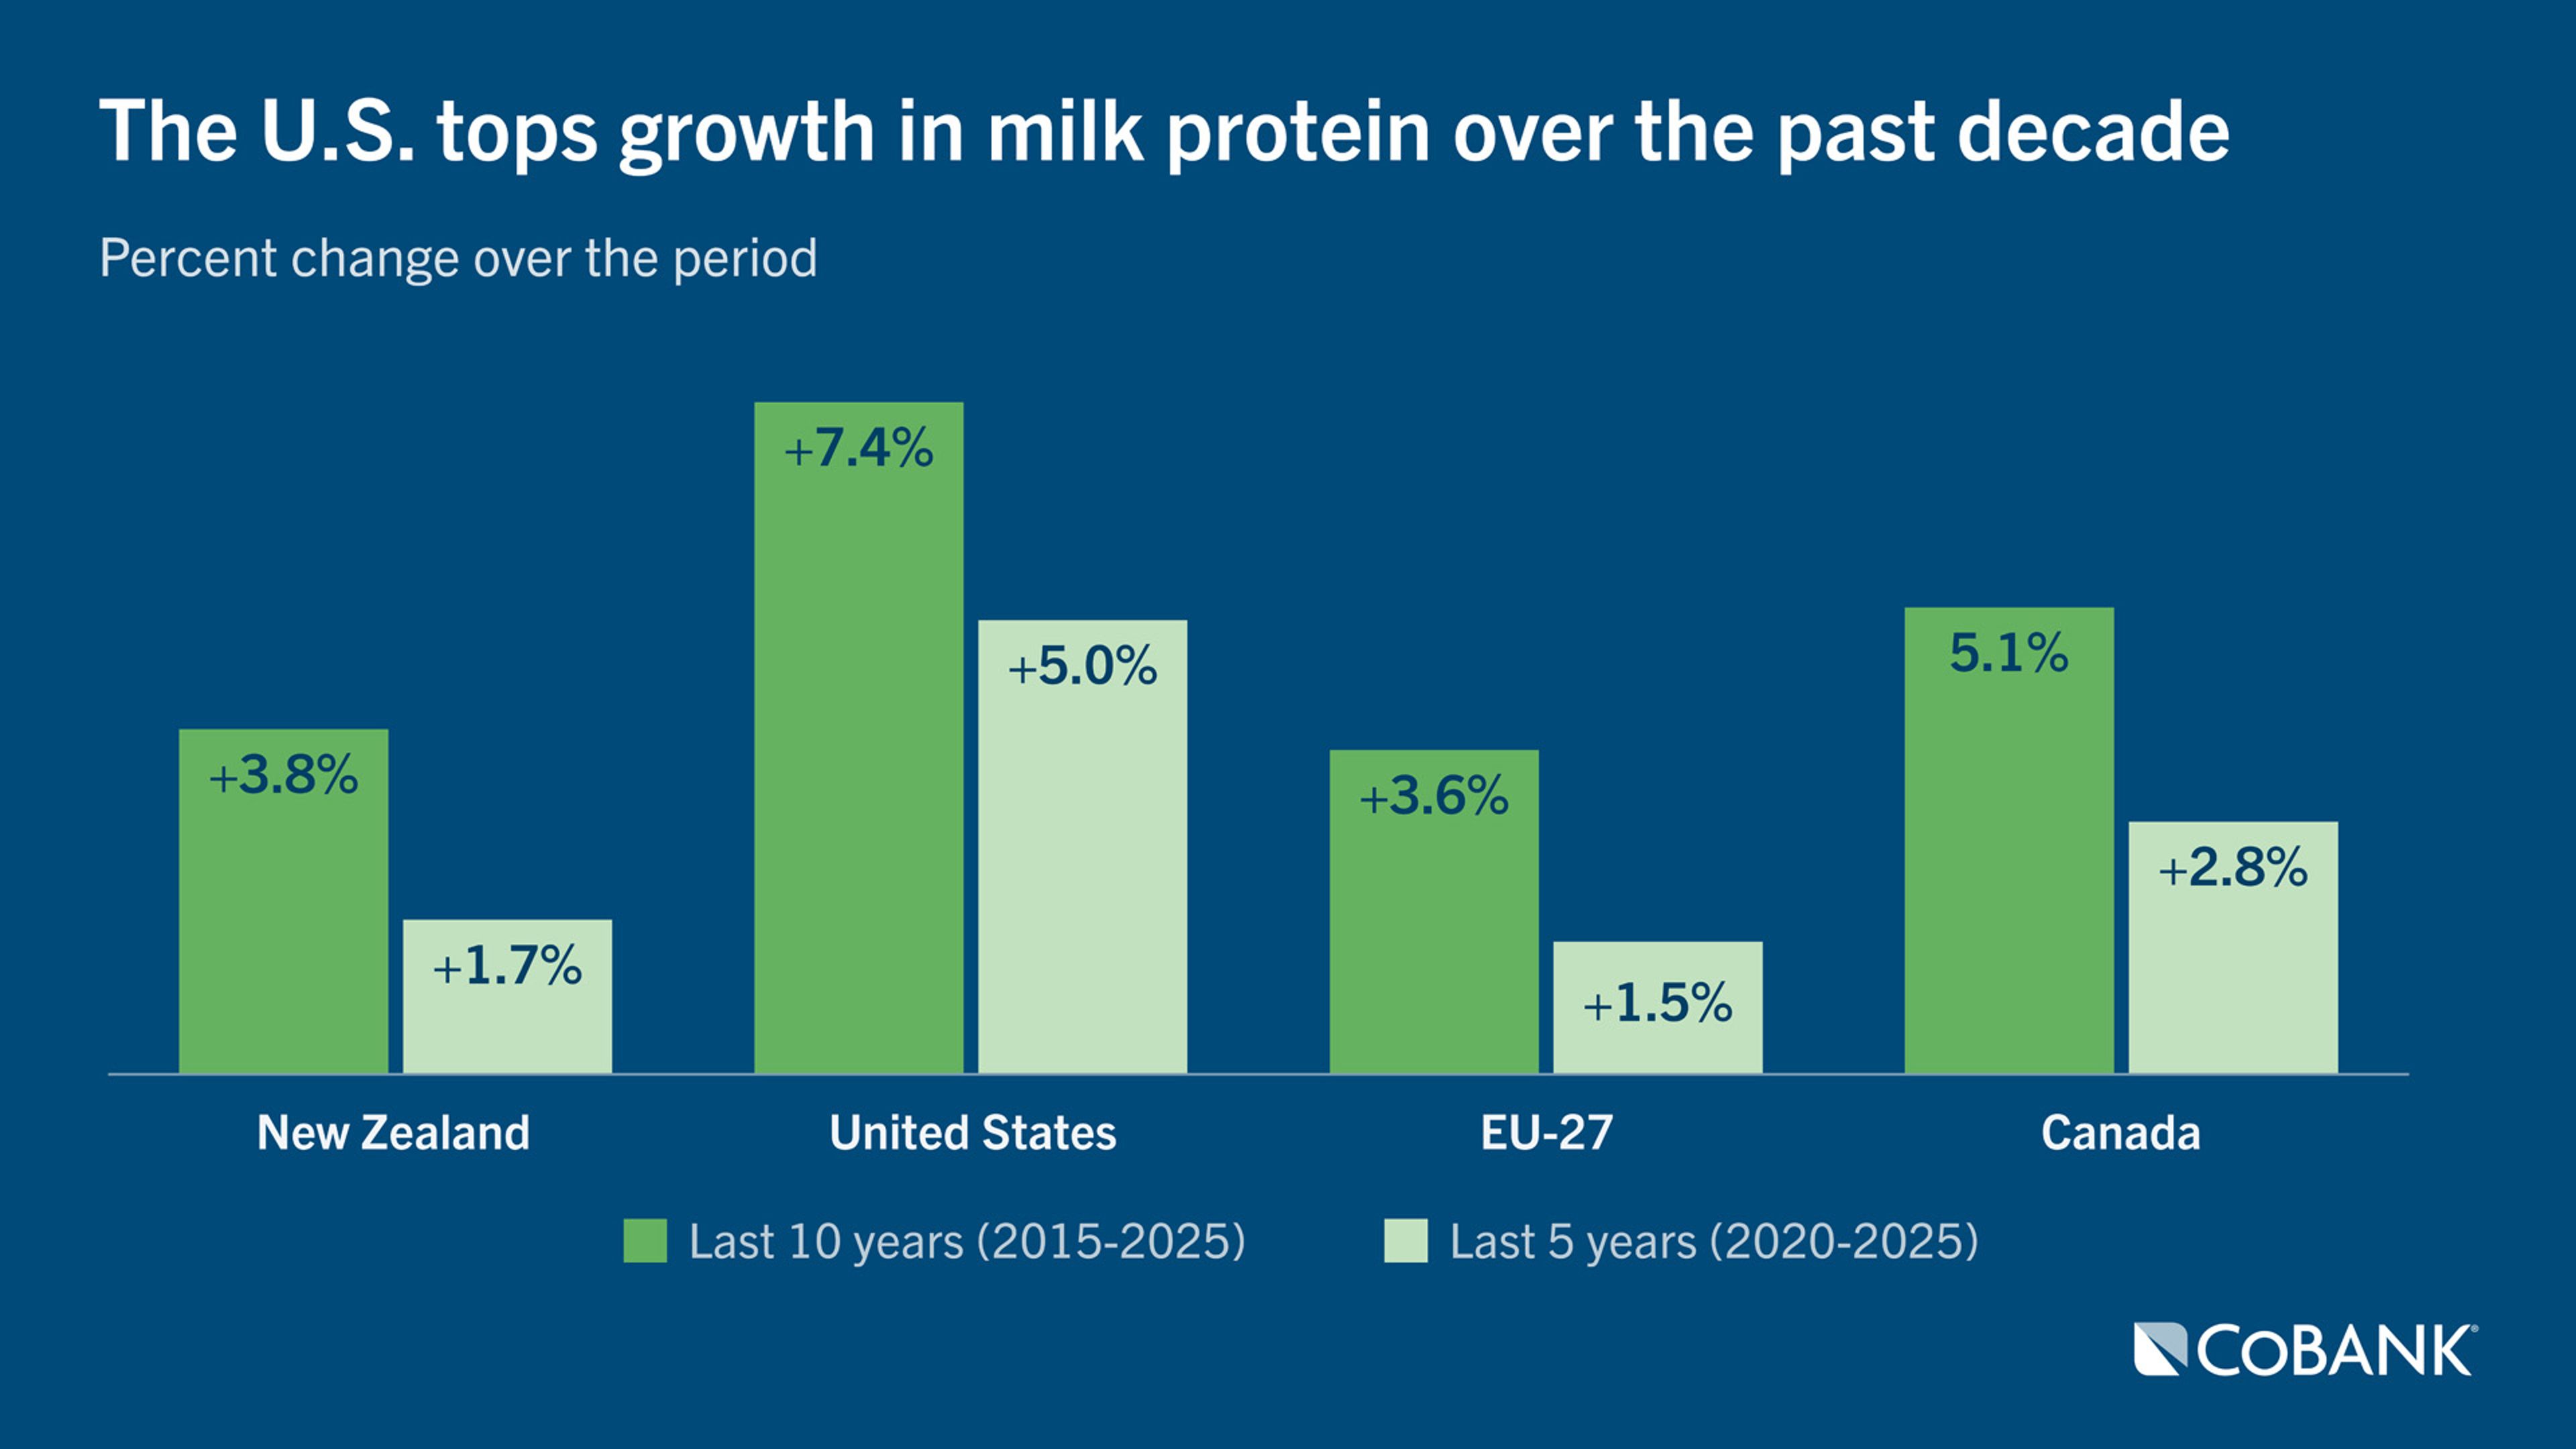
The U.S. still has a lower protein content than New Zealand and the EU, but its growth trajectory leads the pack. From 2015 to 2025, American dairy farmers improved protein production by 7.4%, with two-thirds of those gains taking place in the most recent five years. By contrast, New Zealand and the EU each improved protein content by 2.1% in the first half of the decade, then slowed to 1.7% and 1.5%, respectively, in the second half.
And looking at just the past two years, U.S. milk protein levels rose from 3.29% in 2024 to 3.34% in 2025, a notable gain. Canada and the EU also recorded increases, while New Zealand’s protein level remained at 4.02% for both years.
Why the protein-to-fat ratio matters for cheese
Think of the protein-to-fat ratio as the cheese maker’s balance sheet inside the milk supply. Too little protein relative to fat can reduce efficiency, force processors to add protein solids and leave more butterfat looking for a home.
Although cheese-making formulas are tailored to specific varieties, a protein-to-fat ratio above 0.80 is typically more desirable for cheese production. Some cheese varieties always require adding some milk protein solids to a cheese vat. But as the protein-to-fat ratio tumbled from 0.83 to 0.77 over the past decade, the new norm is for nearly all U.S. cheese makers to routinely add milk protein solids to cheese vats or spin off excess sweet cream. (Sweet cream is the term that processors use for butterfat).
In comparison, New Zealand and the EU have held far more constant. While New Zealand’s ratio has varied slightly, it started 2015 at 0.77 and finished 2025 at the same number. The EU protein-to-fat ratio has held straight as an arrow between 0.83 and 0.84 over the decade.
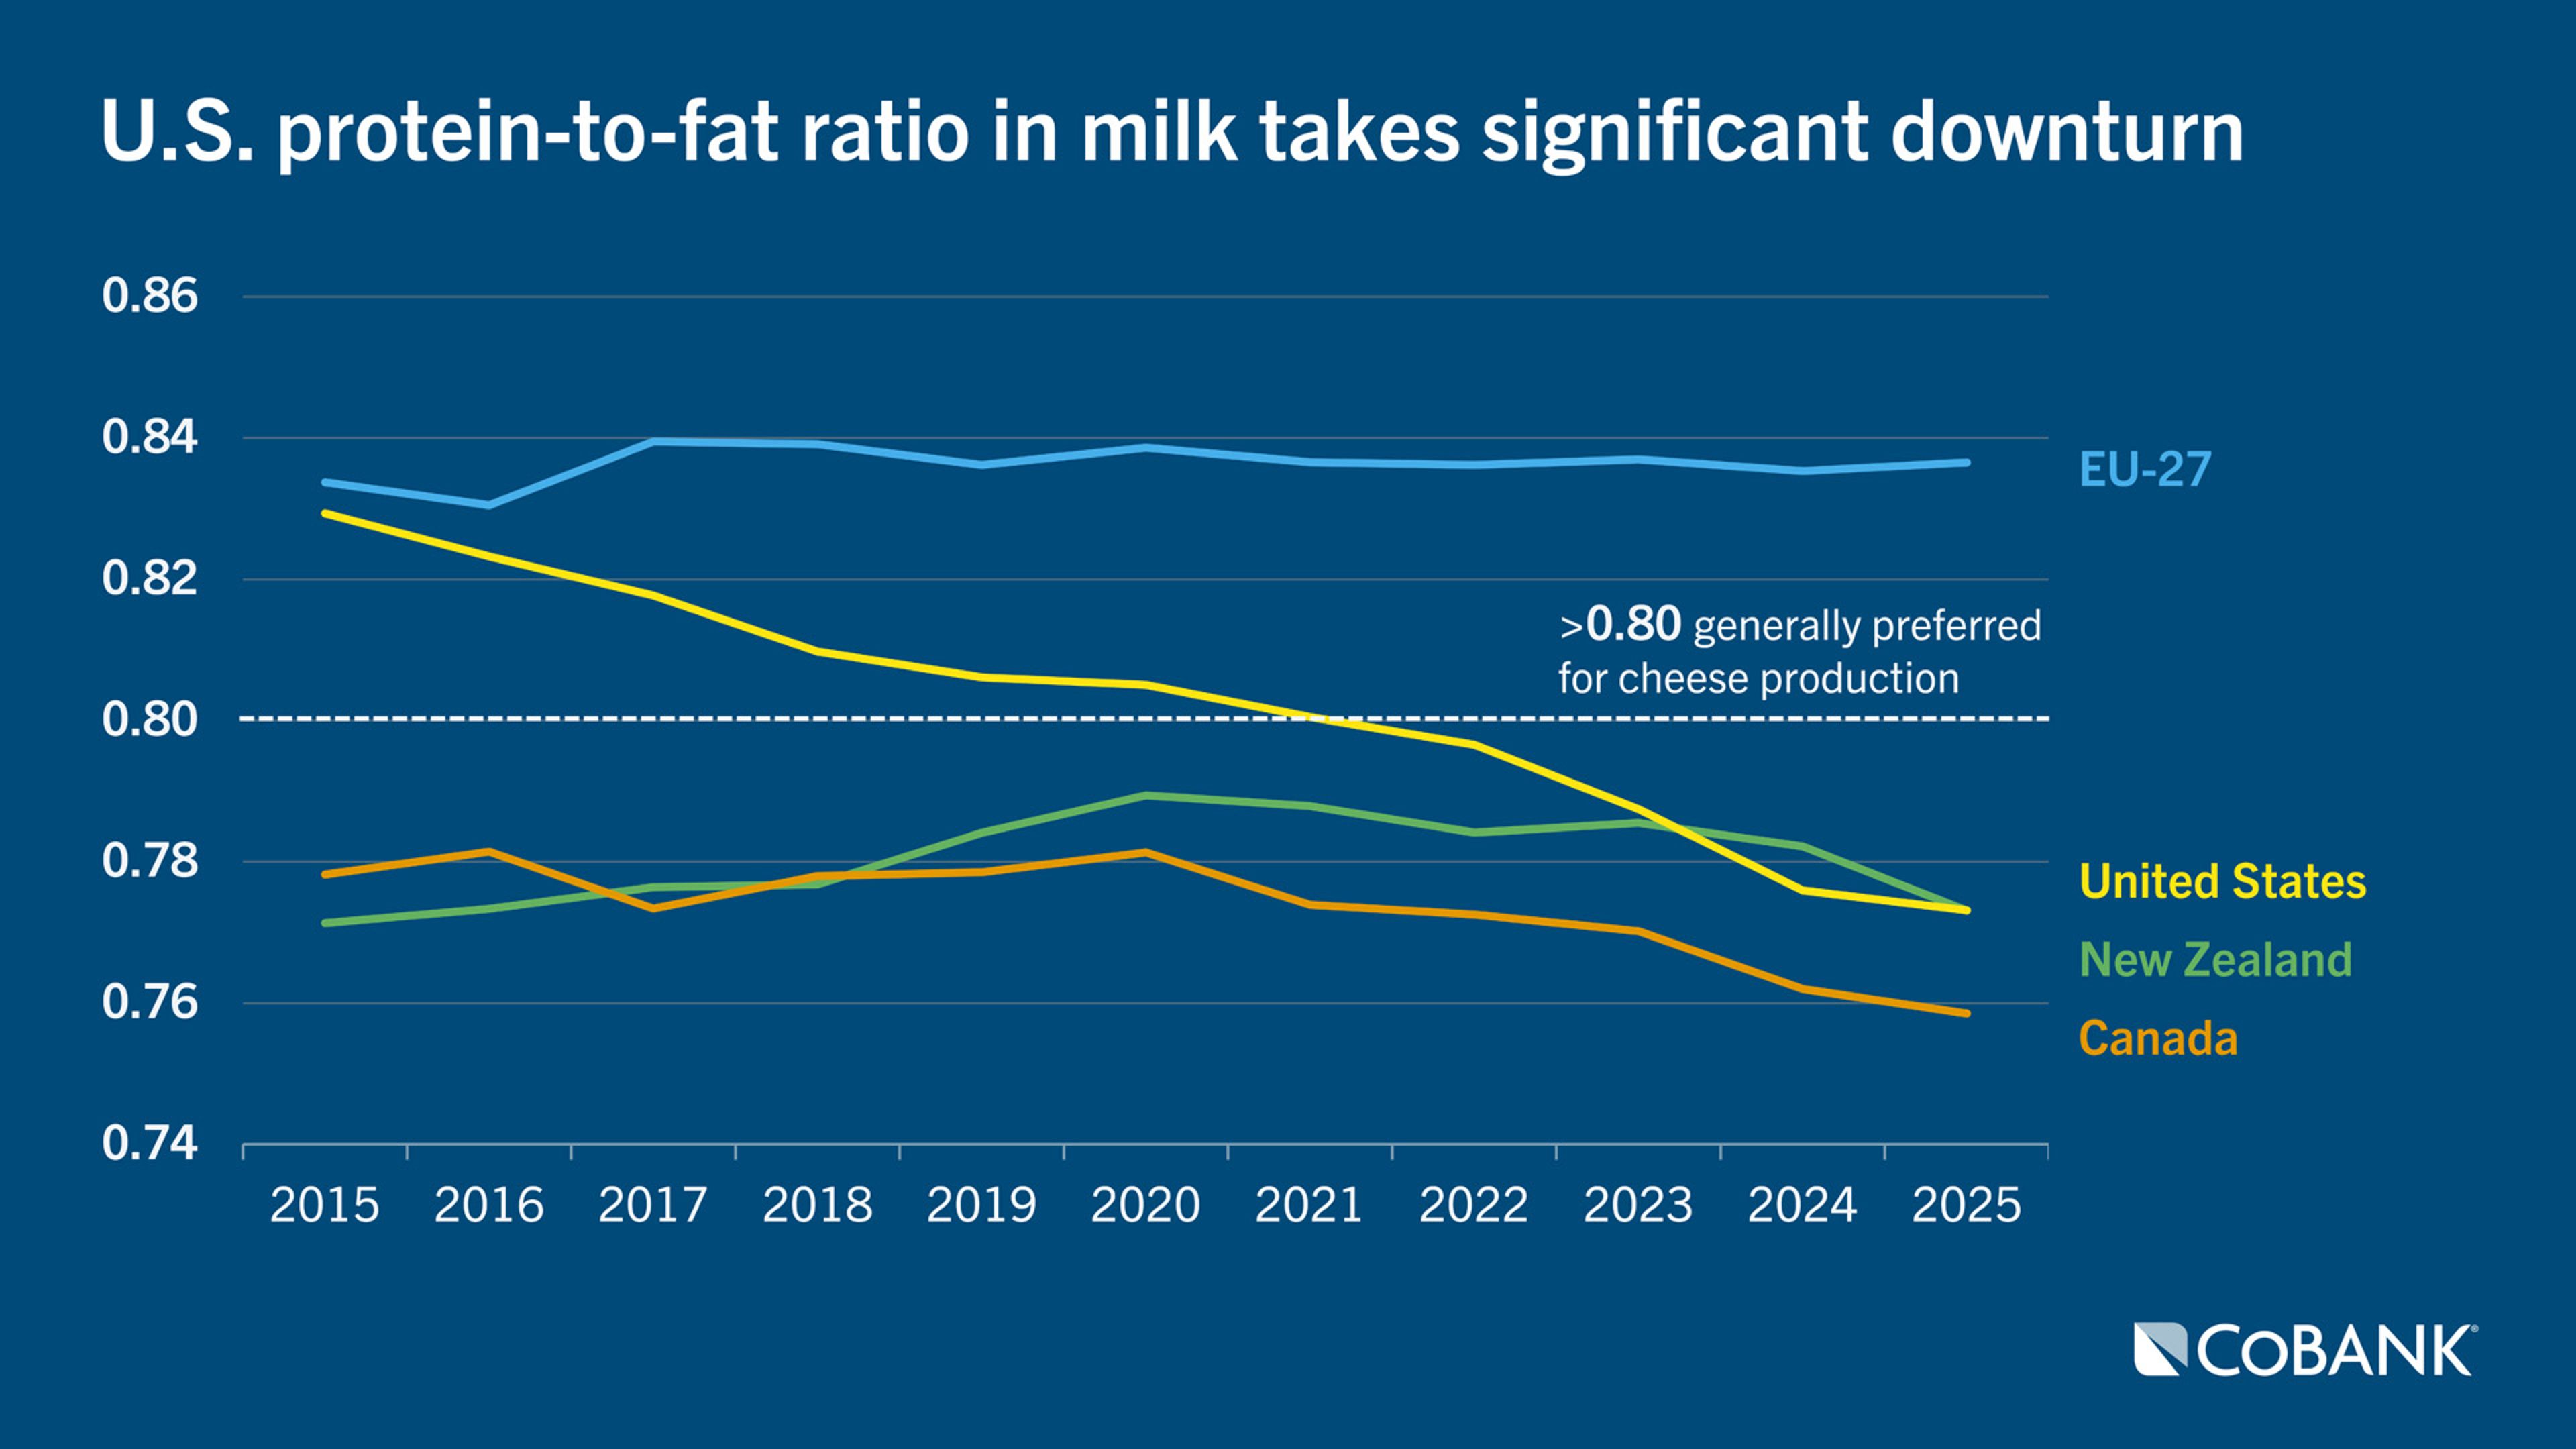
The difference in protein-to-fat ratios reflects each exporter’s product mix. The EU makes far more cheese than New Zealand, so maintaining a higher ratio is paramount for European processors. According to Eurostat, 39% of whole milk solids in the EU went to cheese vats, compared to just 15% in New Zealand. The New Zealand figure is based on data from Fonterra, the country’s largest dairy cooperative, which processes nearly 80% of the country’s milk.
A decade ago, the U.S. protein-to-fat ratio mirrored the EU at 0.83. That ratio has since skidded to its low point of 0.77, creating a major challenge for cheese production. Based on updated calculations by CoBank and Mike McCully, a leading dairy industry consultant, 49% of all U.S. milk on a total solids basis goes to cheese vats. USDA metrics have pegged a lower number at 42%.
As a result, most U.S. cheese makers are fortifying vats with protein, spinning off significant levels of sweet cream, or both. This trend is accelerating as whey protein concentrate and whey protein isolate production reach record highs. At the same time, high-protein products such as cottage cheese, high protein dairy beverages, and Greek yogurt are leading sales growth, each rising more than 7% year-over-year, according to Circana sales data.
Protein has competing end uses, and the lower protein-to-fat ratio may leave potential cheese-making value unrealized. At the same time, the extra U.S. butterfat needs outlets. Through June, U.S. butterfat exports were up 83% year to date at 89 million pounds, bringing first-half year exports to 196 million pounds — nearly double of calendar year 2024. Top final destination export markets include the Middle East and North Africa (MENA), Mexico, Central America and the Caribbean, and South Korea.
Protein prices begin to shift incentives
The component imbalance did not happen by accident. For much of the past decade, milk checks sent farmers a clear signal: butterfat paid better. Producers responded rationally, adjusting farm-level decisions about genetics, nutrition and production strategy, and the milk supply changed accordingly.
From January 2015 through August 2025, butterfat prices outpaced protein prices for 82 of the 128 months. Across the full period, butterfat had an advantage over protein by 22 cents per hundredweight (cwt). COVID-related market anomalies in 2020 and 2021 temporarily caused protein to overtake butterfat values. But during the 82 months when butterfat values were higher, the average spread was 93-cent per cwt. That price signal encouraged dairy producers and dairy cow nutritionists to implement strategies that boosted butterfat production, resulting in the 9.4% growth over the past five years.
Butterfat led milk checks for good reason. The U.S. historically imported butterfat, with imports at 10 million pounds in 2010 before climbing to 100 million pounds in 2021 and peaking at 173 million pounds in 2024. Imports then fell to 98 million pounds in 2025. On the export side, U.S. milk-fat exports hovered between 4.6% and 5.2% of the milk supply from 2011 to 2024, meaning U.S. dairy processors sold most butterfat domestically. During the same period, skim solids exports rose from 16.6% to 21.6% of the U.S. milk supply. As a result, butterfat was the leading milk component during most of this period.
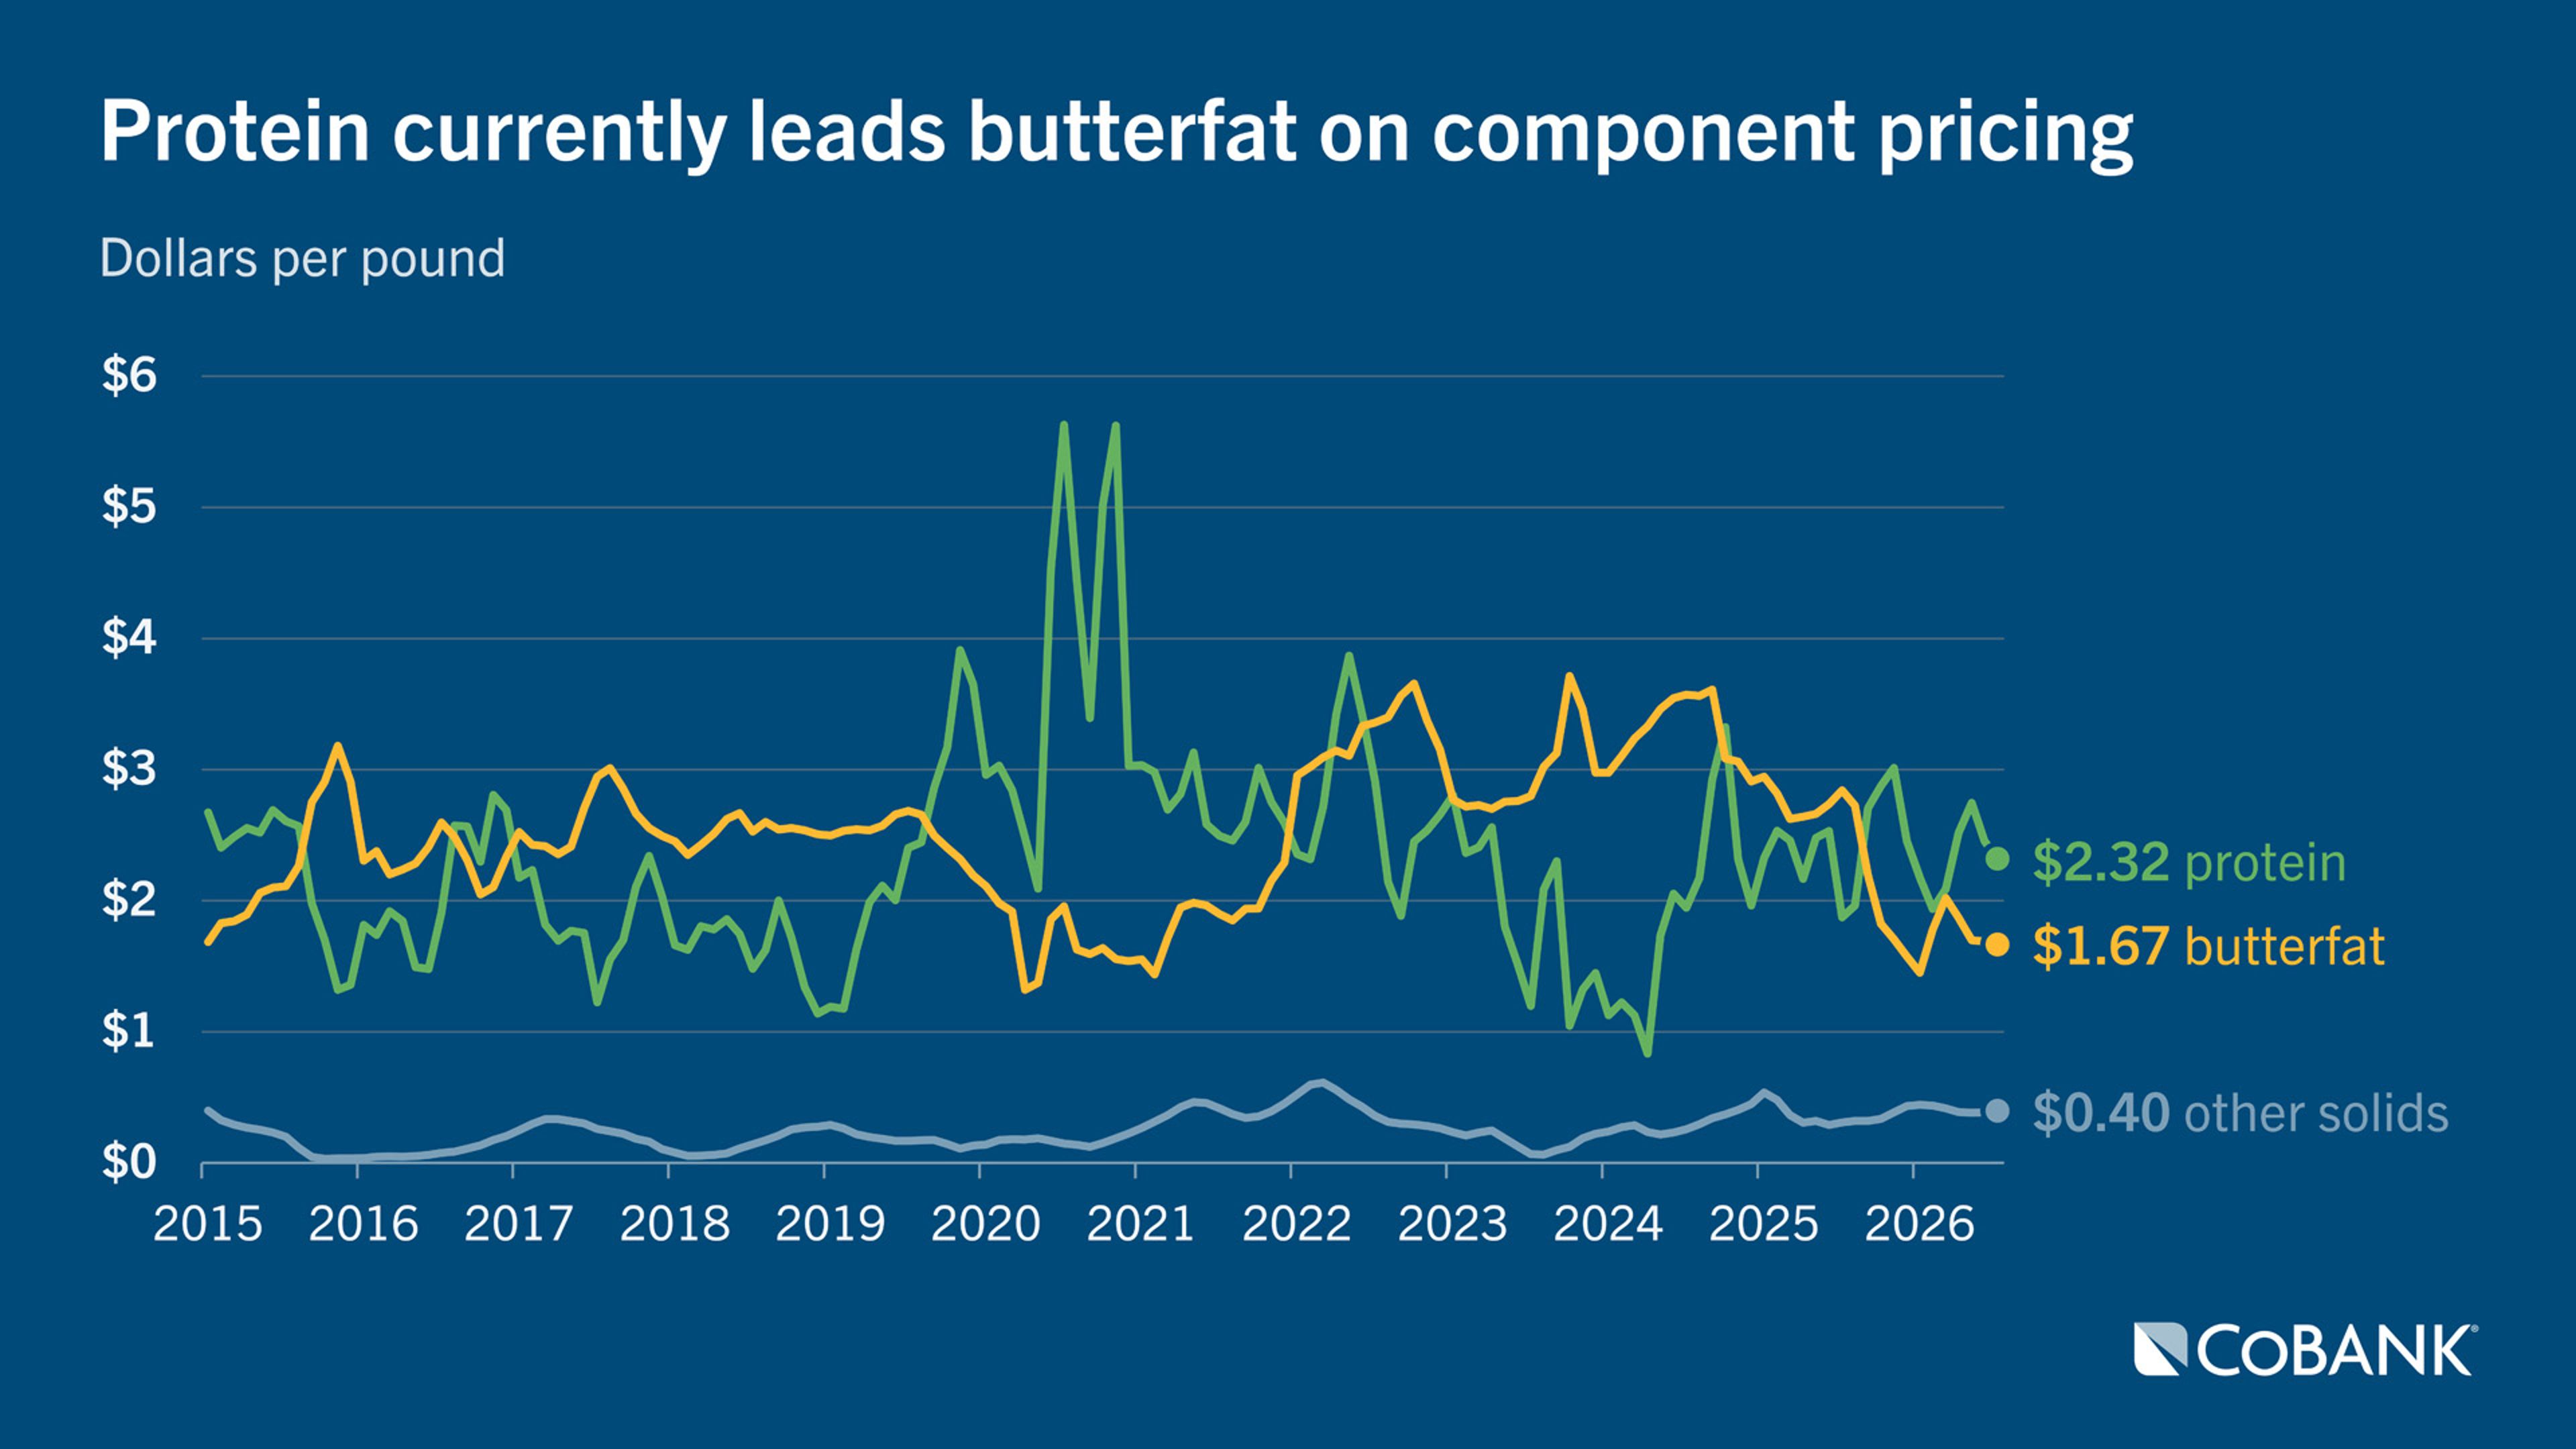
That dynamic began a slow shift last year when protein values overtook butterfat in August 2025. During the ensuing seven months, protein values ran 72 cents per cwt. higher than butterfat. As a result, protein production on a pound basis started outpacing butterfat in the U.S.
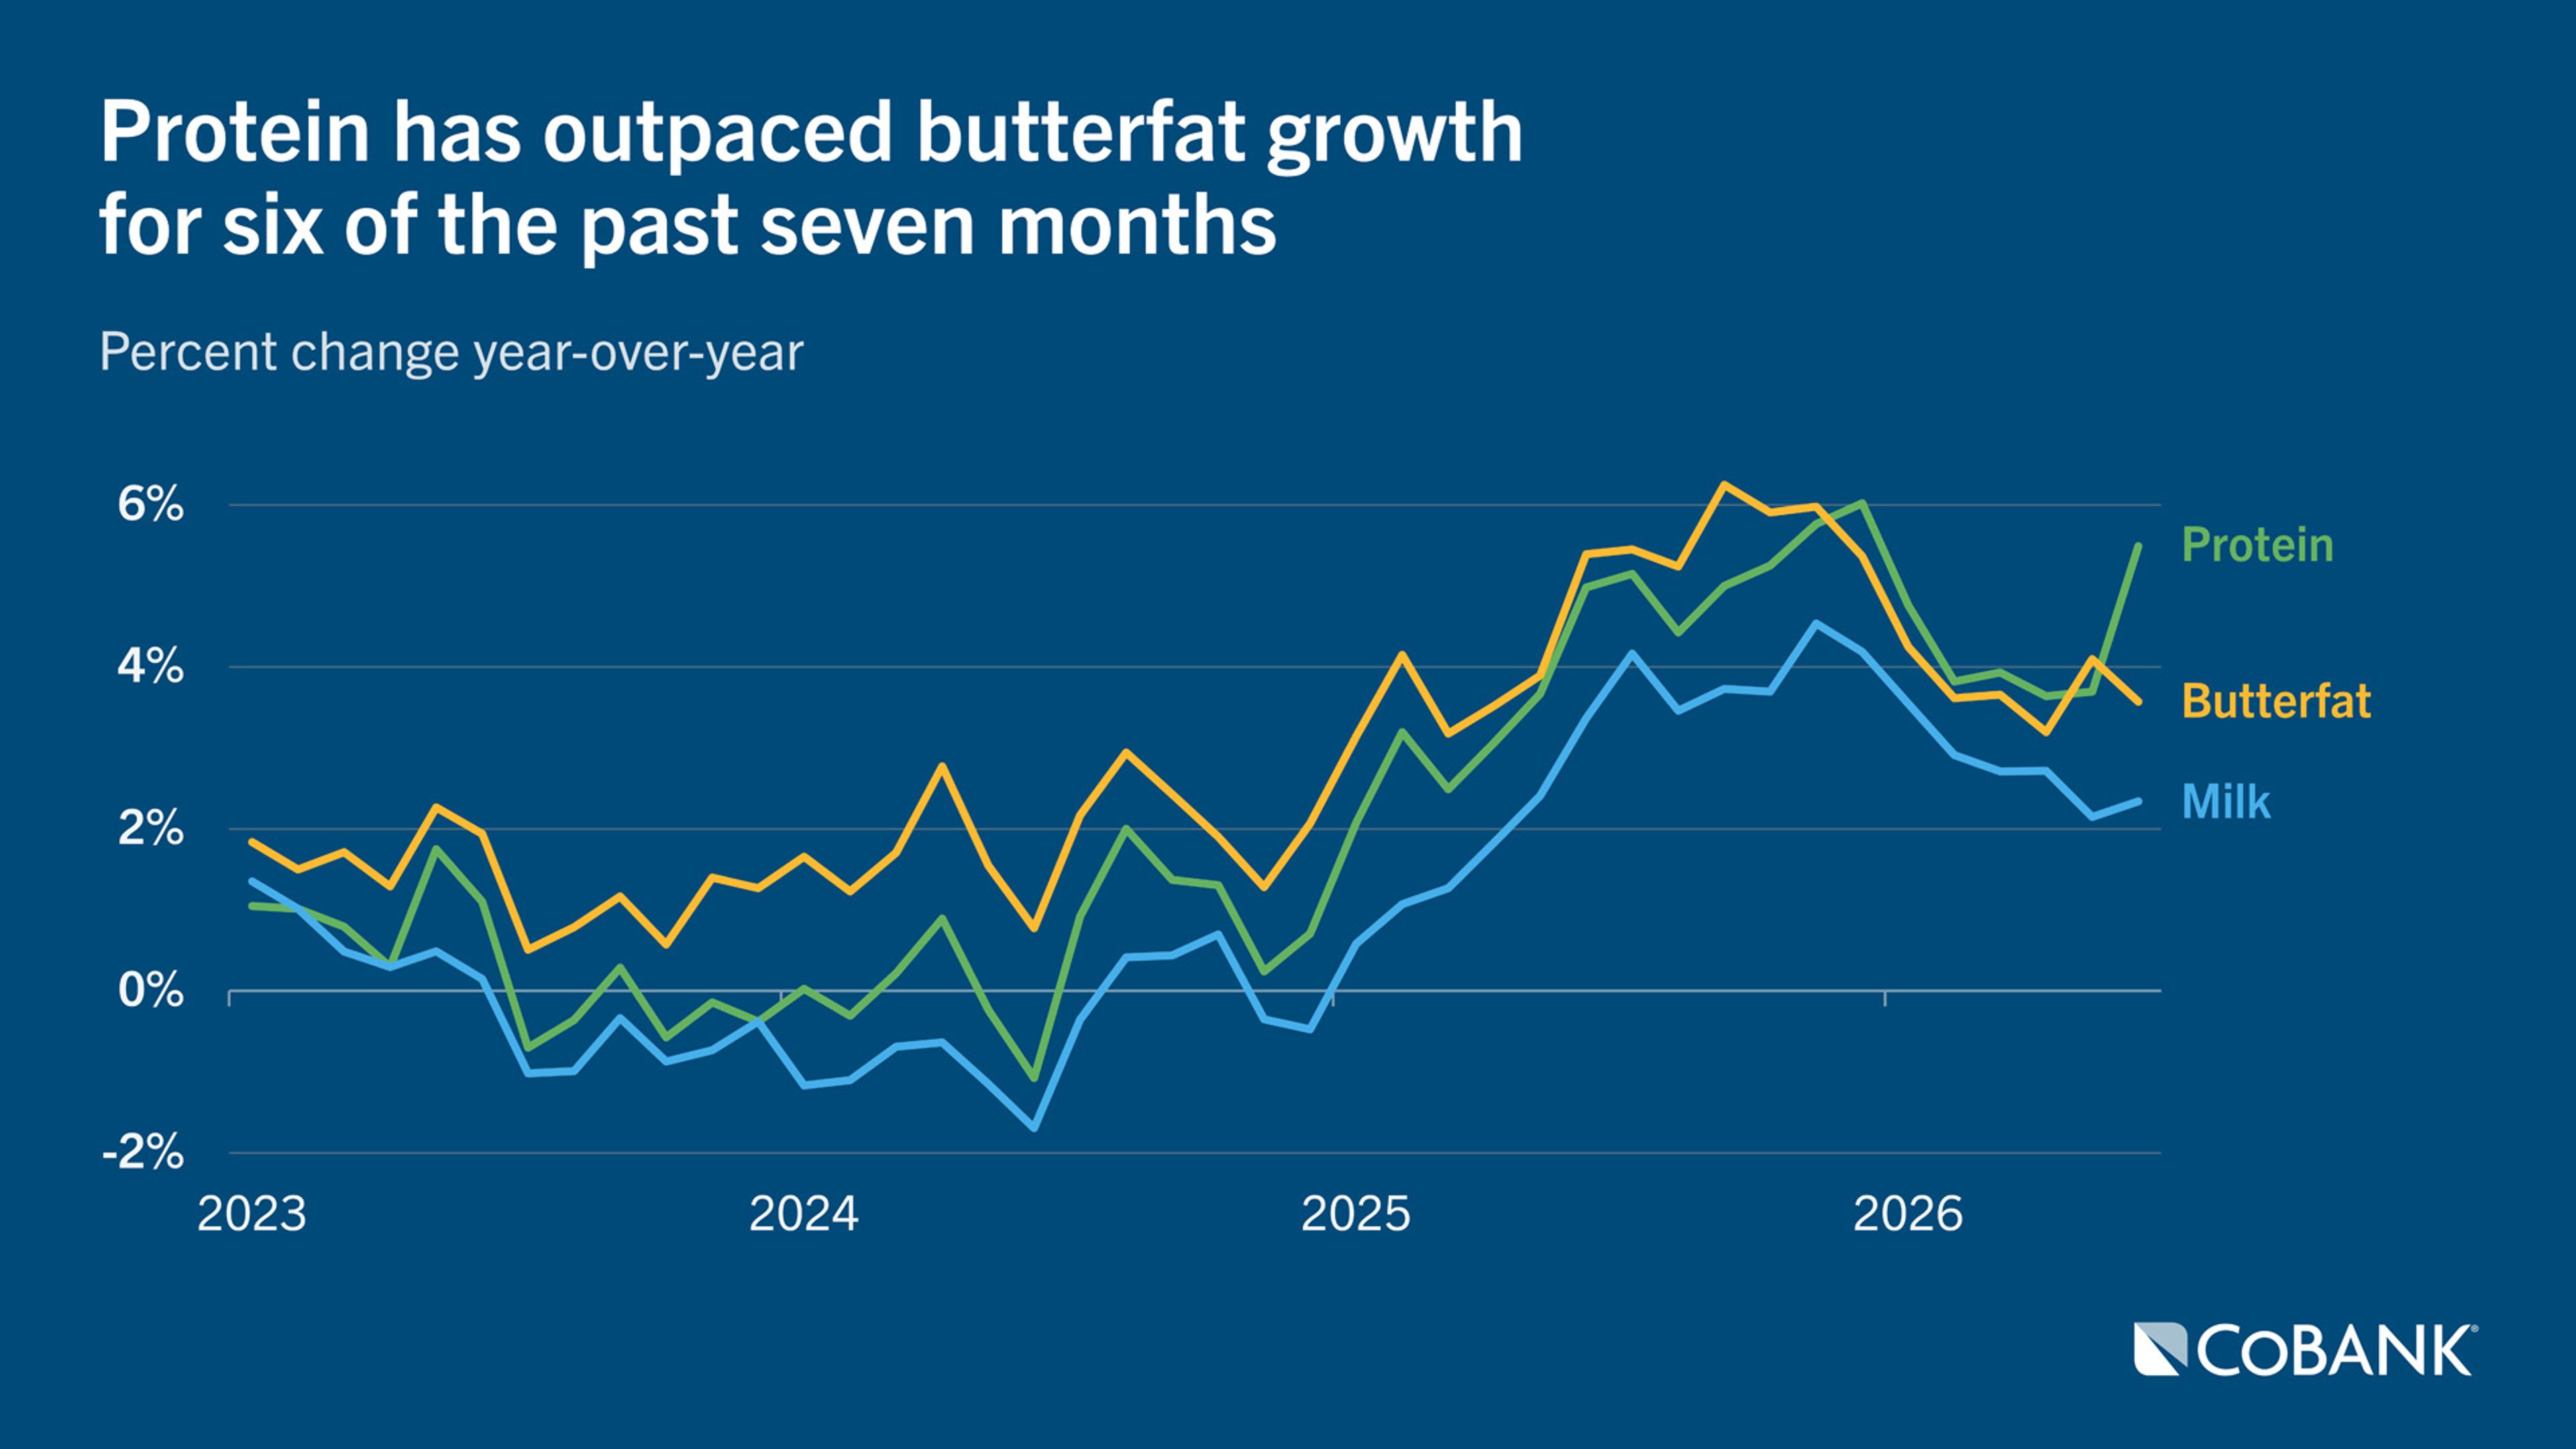
With more than 90% of the U.S. milk supply paid for on a multiple component pricing (MCP) basis, this shift shows dairy farmers will adjust strategies to reflect marketplace demand and price structures. Recently, some cheese makers have taken a different approach by instituting topside caps on butterfat levels. For example, a cap of 4.5% would mean no additional payment for butterfat above that level. That approach may slow larger volumes of butterfat flowing from farms, but it does not incentivize protein production. Plus, that extra butterfat does still have value in the marketplace. An alternative idea would be to revamp pricing formulas to more closely reflect cheese yield.
What the future holds
The shift to higher protein growth rates has occurred over a short window as shown in the previous graph. Restoring the protein-to-fat ratio to its decade-ago level of 0.83 will require years of sustained protein gains.
The Holstein Association USA took steps earlier this year to put more emphasis on protein through its update to the Total Performance Index. Of the 100-point scale, 38 points are assigned to production traits. In March, the nation’s largest dairy breed association raised the protein weighting from 19 to 24 and reduced butterfat from 19 to 14.
Given the role genetics play in milk-component growth, more work on similar indexes would be prudent, along with the development of economically viable feed supplements to enhance protein production. Until protein production gains catch up to butterfat, the U.S. dairy industry will need to find more domestic and international outlets for its growing butterfat supply while continuing to meet the strong demand for dairy protein.
The challenge now is not whether U.S. dairy can grow milk solids. It already has. The challenge is whether it can grow the right solids in the right balance for the products and markets that will define future demand.
Disclaimer: The information provided in this report is not intended to be investment, tax, or legal advice and should not be relied upon by recipients for such purposes. The information contained in this report has been compiled from what CoBank regards as reliable sources. However, CoBank does not make any representation or warranty regarding the content, and disclaims any responsibility for the information, materials, third-party opinions, and data included in this report. In no event will CoBank be liable for any decision made or actions taken by any person or persons relying on the information contained in this report.