
Global supply losses drive cotton, rice and sugar prices higher

Key points
- The shrinking, drought-battered U.S. cotton crop is driving up prices despite demand risks.
- El Niño is threatening world rice production, intensifying fears of tight global supply.
- Production threats are fueling a sugar price rally, outweighing the effects of rising imports.
Cotton
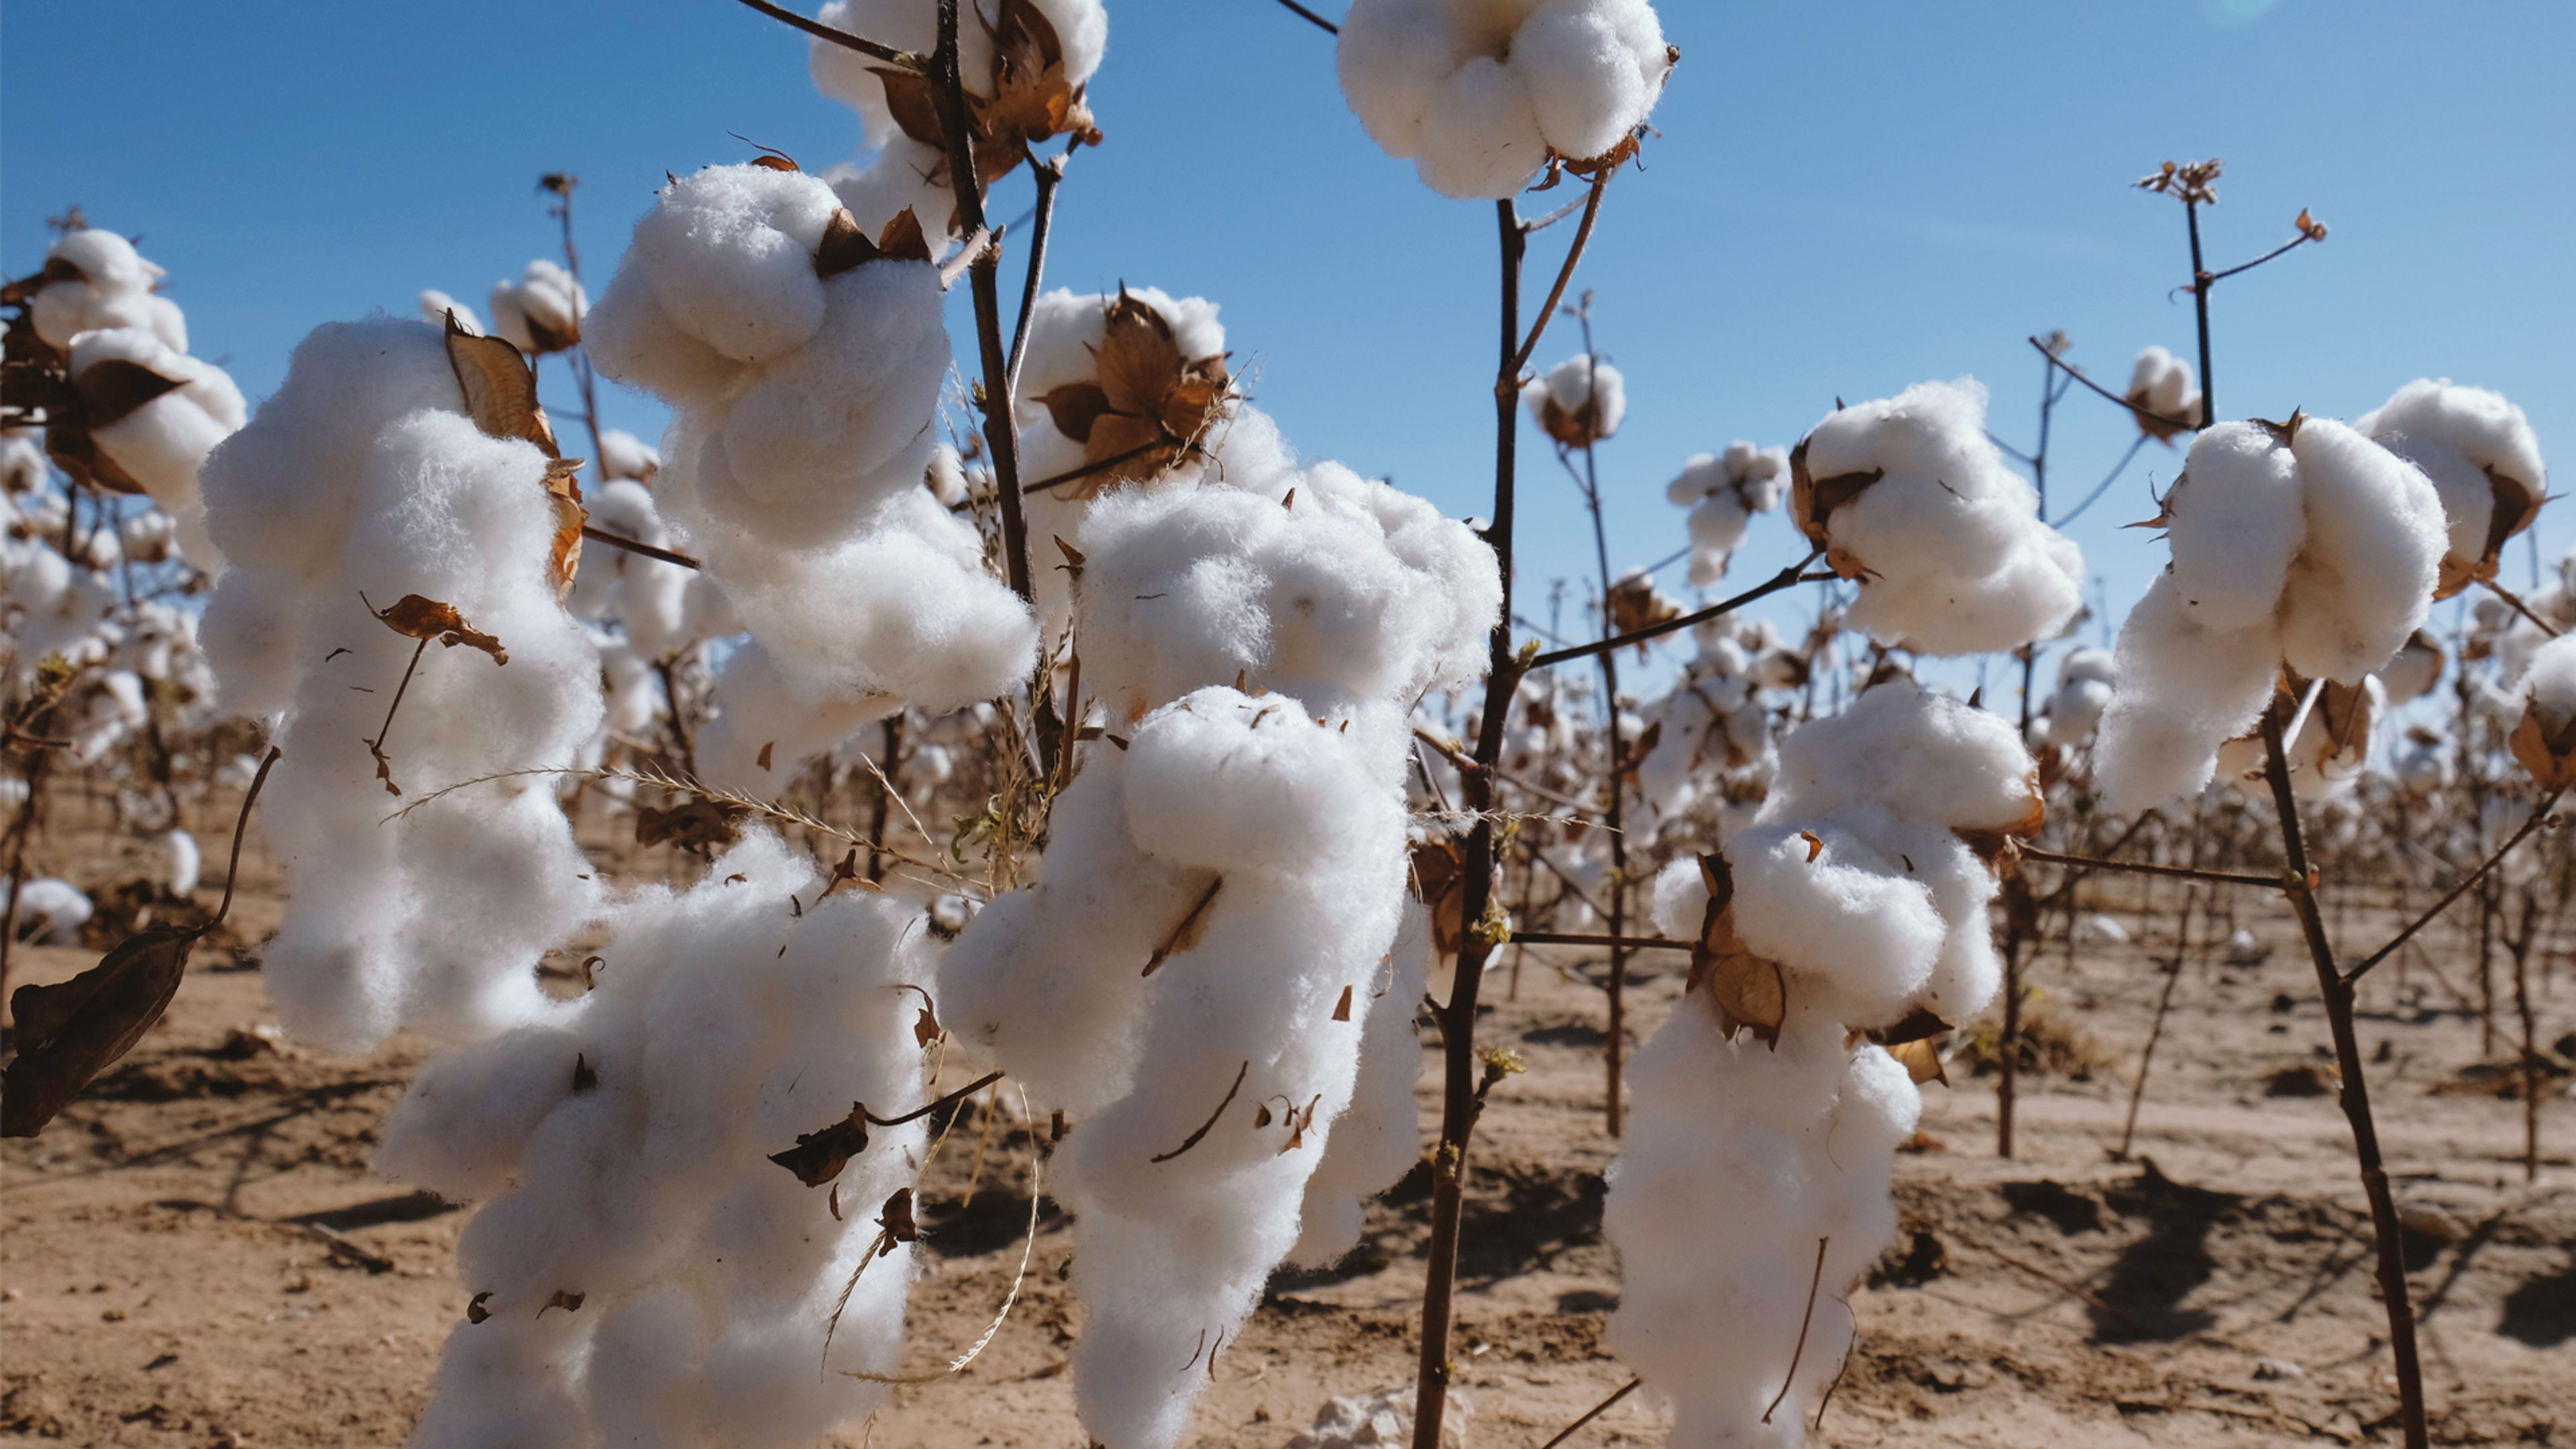
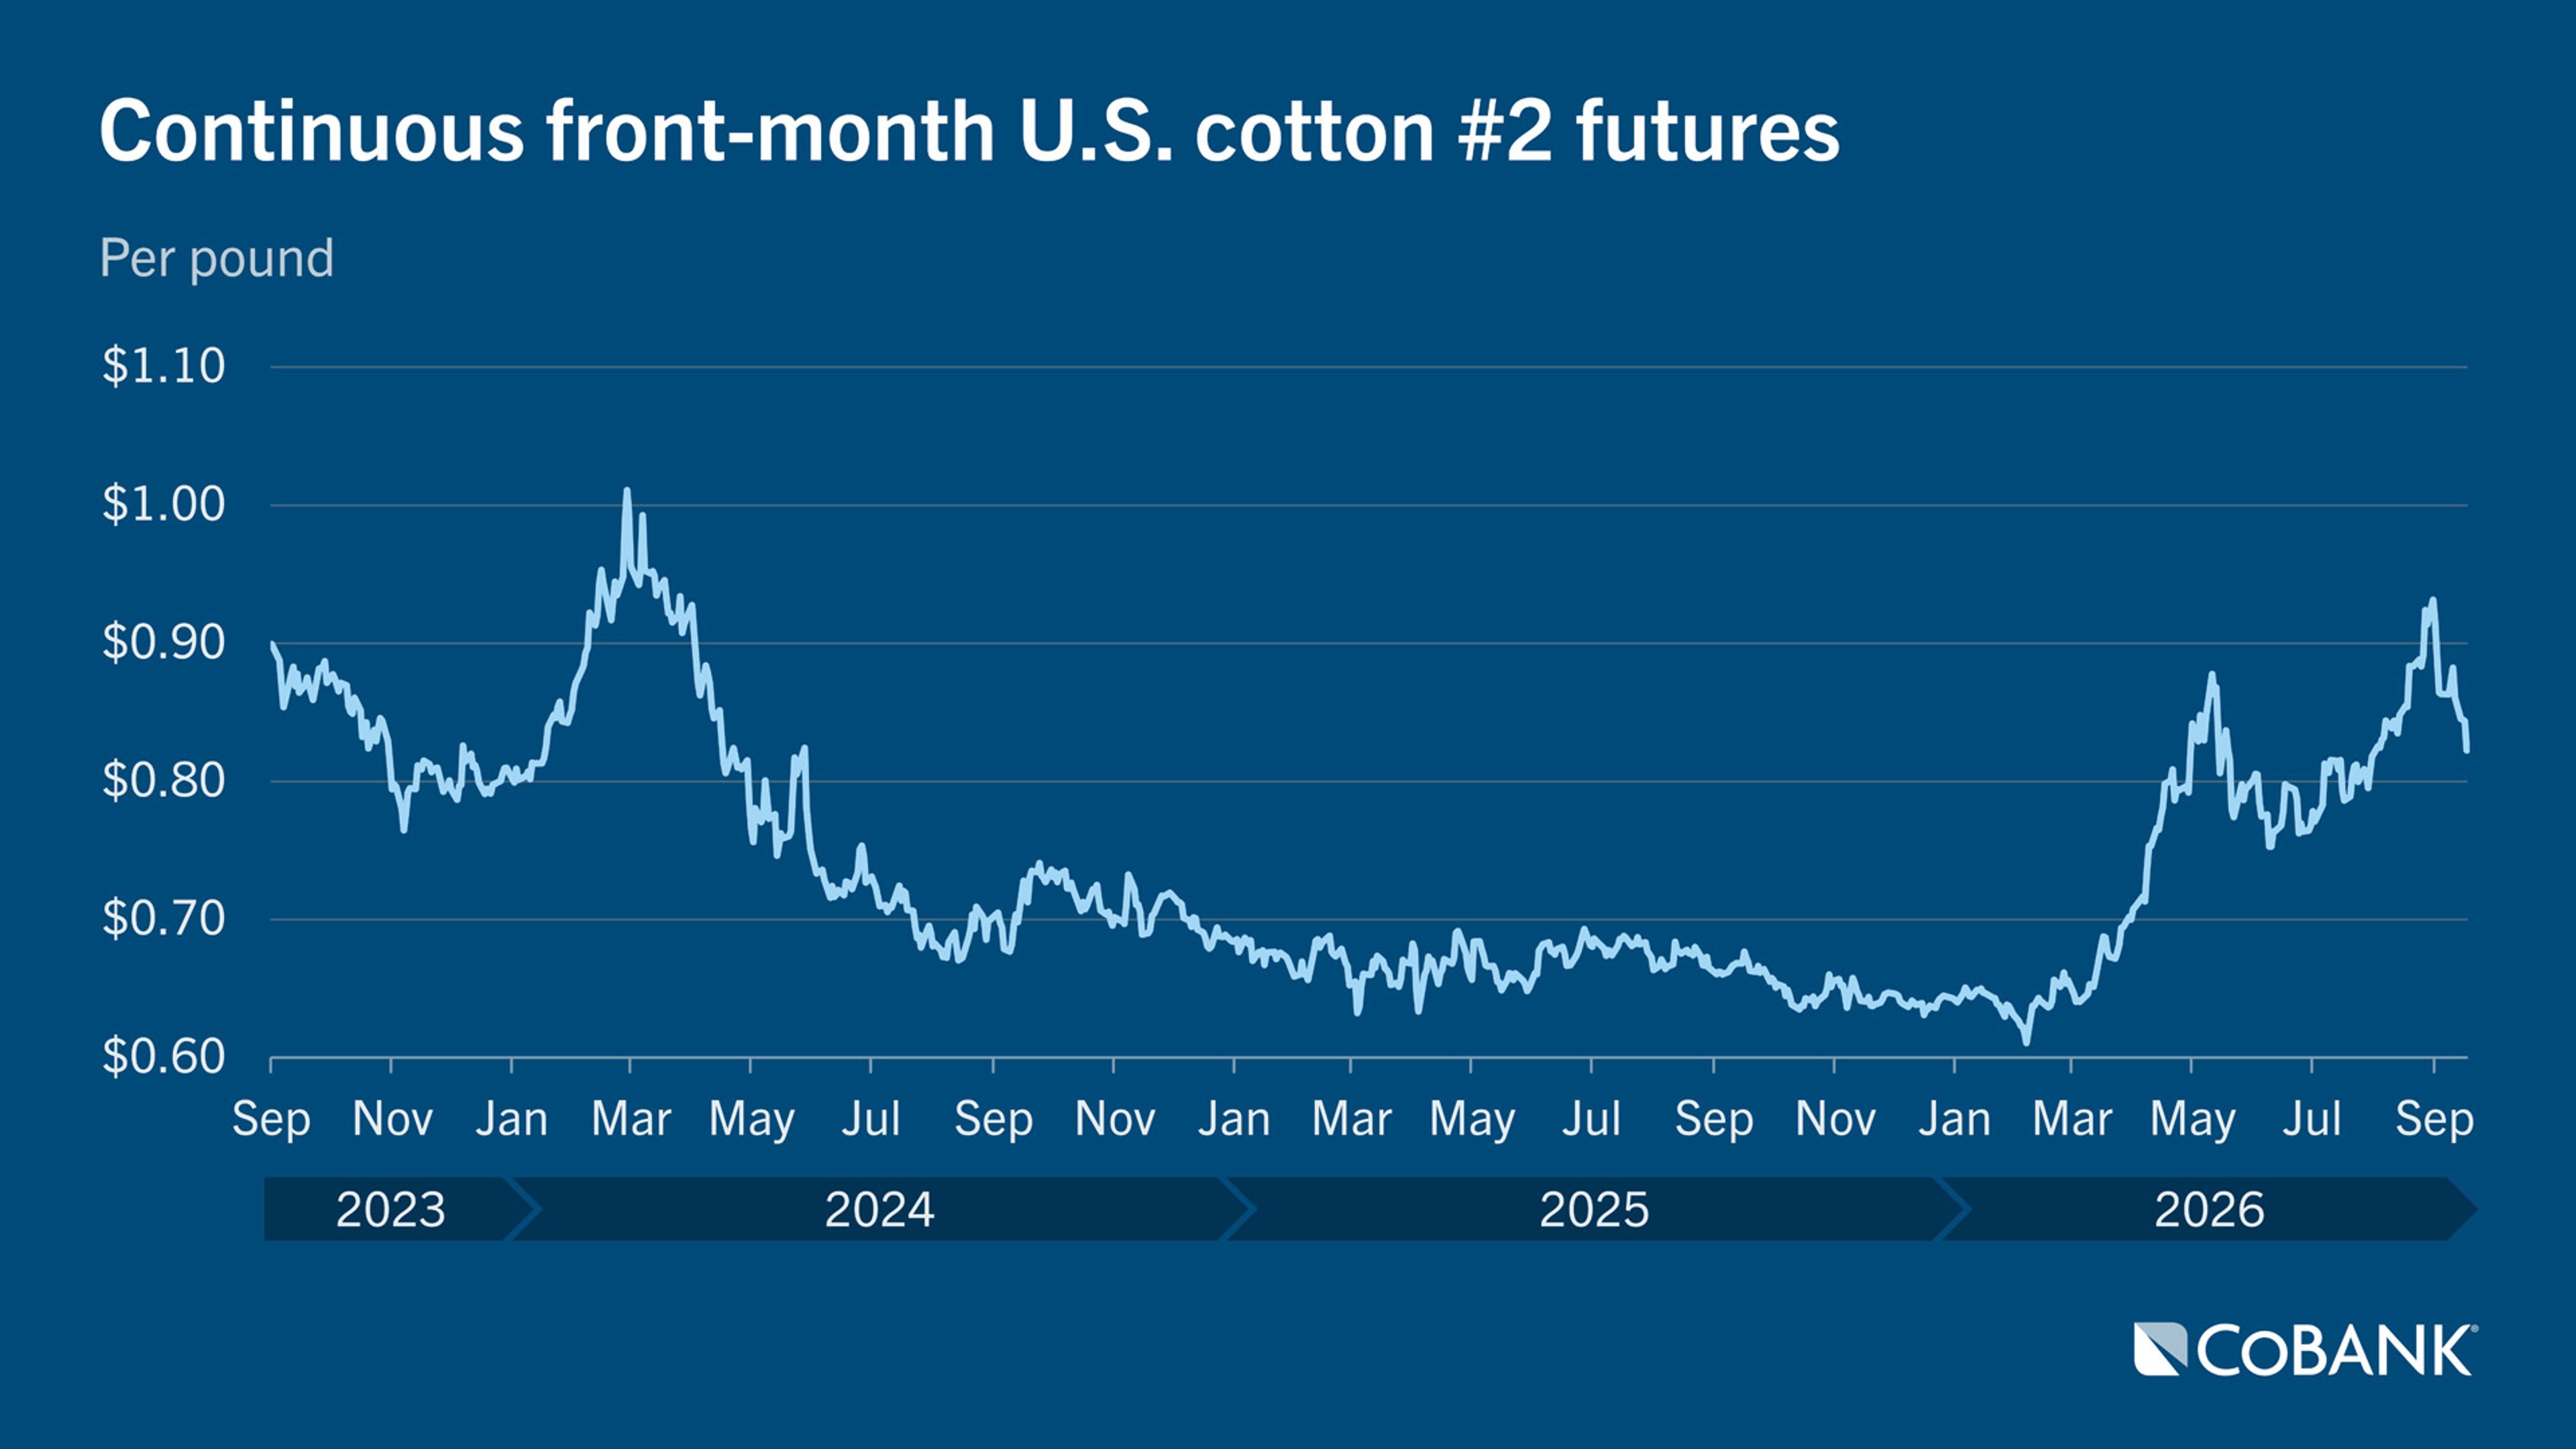
Fears of a shrinking U.S. cotton crop drove cotton prices last quarter to the highest level in 18 months as record heat raised questions over West Texas cotton yields and abandonment. Declining crop conditions late in the quarter signaled that the Texas crop could underperform, with 18% of the crop rated good-to-excellent and 49% rated poor-to-very-poor. USDA forecasts the U.S. cotton crop will decline 5% year over year to 13.2 million 480-pound bales with yields dropping 9% YoY to 776 pounds per acre. Next quarter, the market will focus closely on U.S. harvest yields and whether Brazilian farmers respond to higher cotton prices with expanded acreage.
Demand for U.S. cotton has been resilient with export sales holding strong, aided by higher crude oil prices that raise the cost of synthetic fibers and give natural fibers like cotton a cost advantage. Total export commitments of shipped and unshipped sales at the end of the quarter rose 13% YoY on robust sales to Vietnam. Chinese demand for U.S. cotton remains weak, but the industry hopes it will increase following China’s removal of the 10% retaliatory tariff on U.S. cotton.
Inflation and expectations of higher interest rates cloud cotton’s demand outlook. Inflation-weary consumers are trading down or delaying spending on clothing and apparel, while potential rate increases from the Federal Reserve threaten to raise consumers’ borrowing costs and discourage exports via a strengthening the U.S. dollar.
Rice
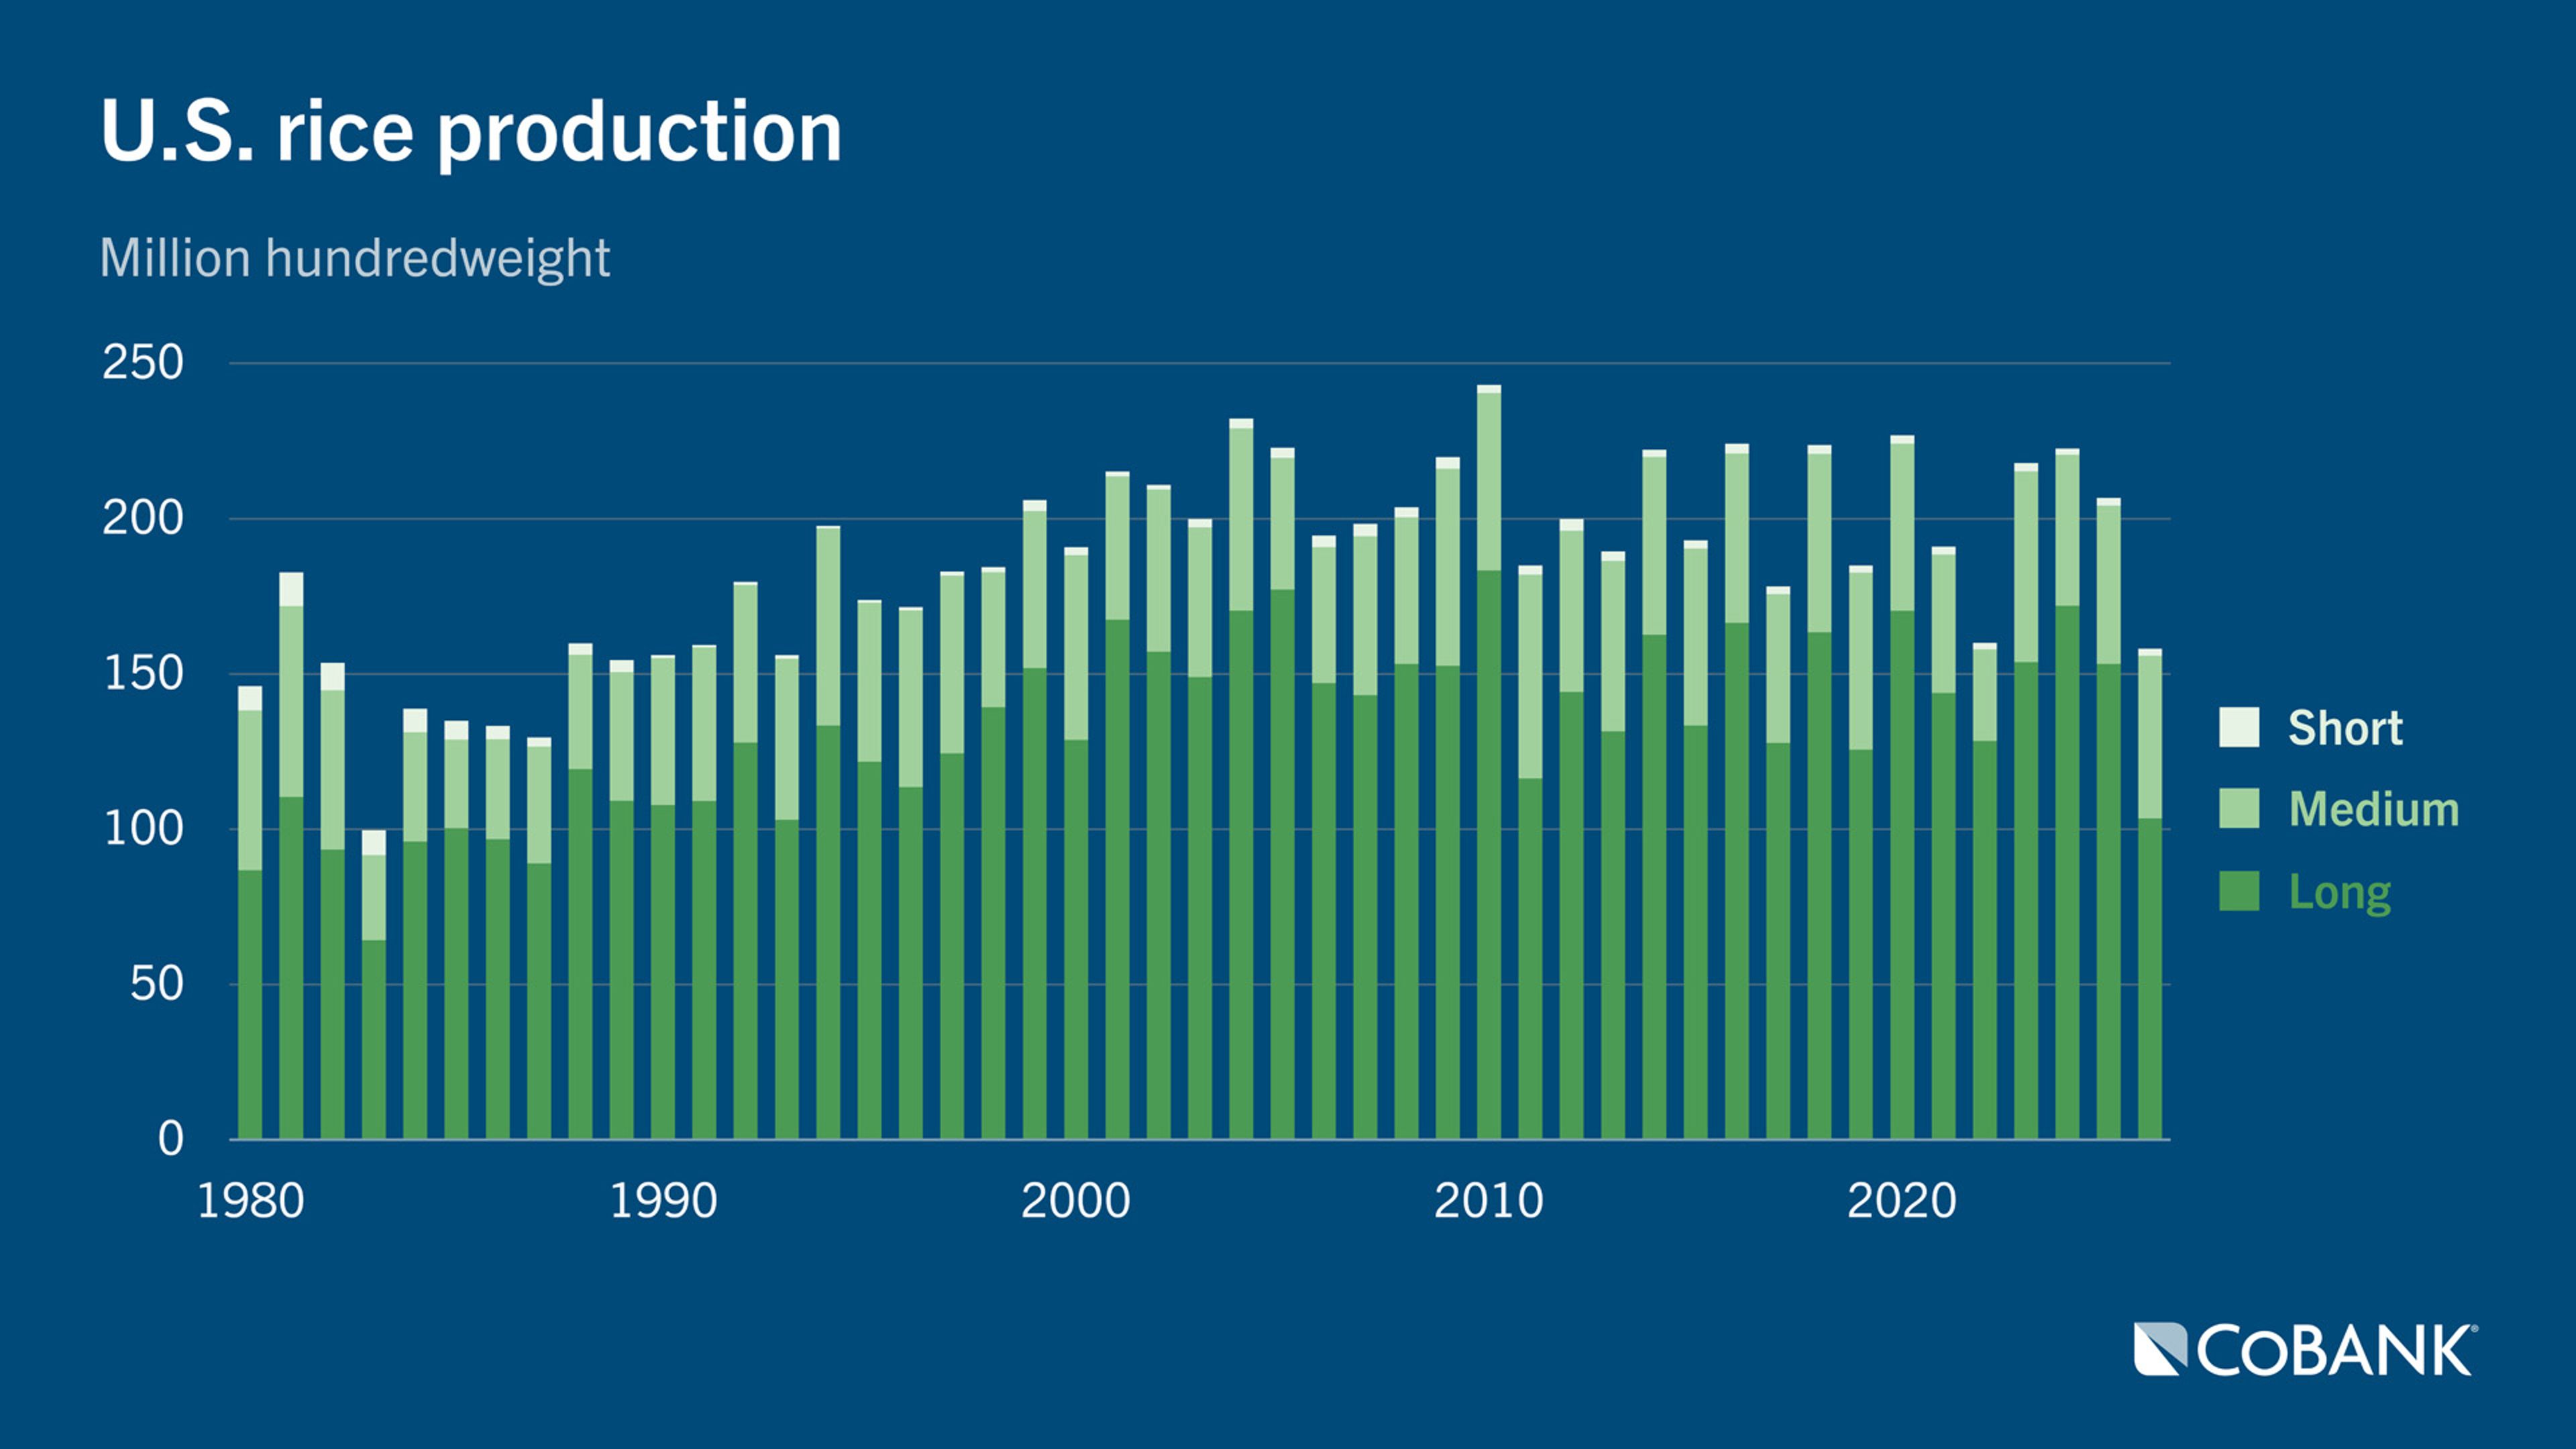
After U.S. rice acreage fell 25% YoY this spring, USDA expects the U.S. rice harvest to be the smallest since 1990 at 158.2 million hundredweight. The long-grain crop grown mostly in the Mid-South and Gulf states suffered a 32% YoY drop to 103.5 million hundredweight.
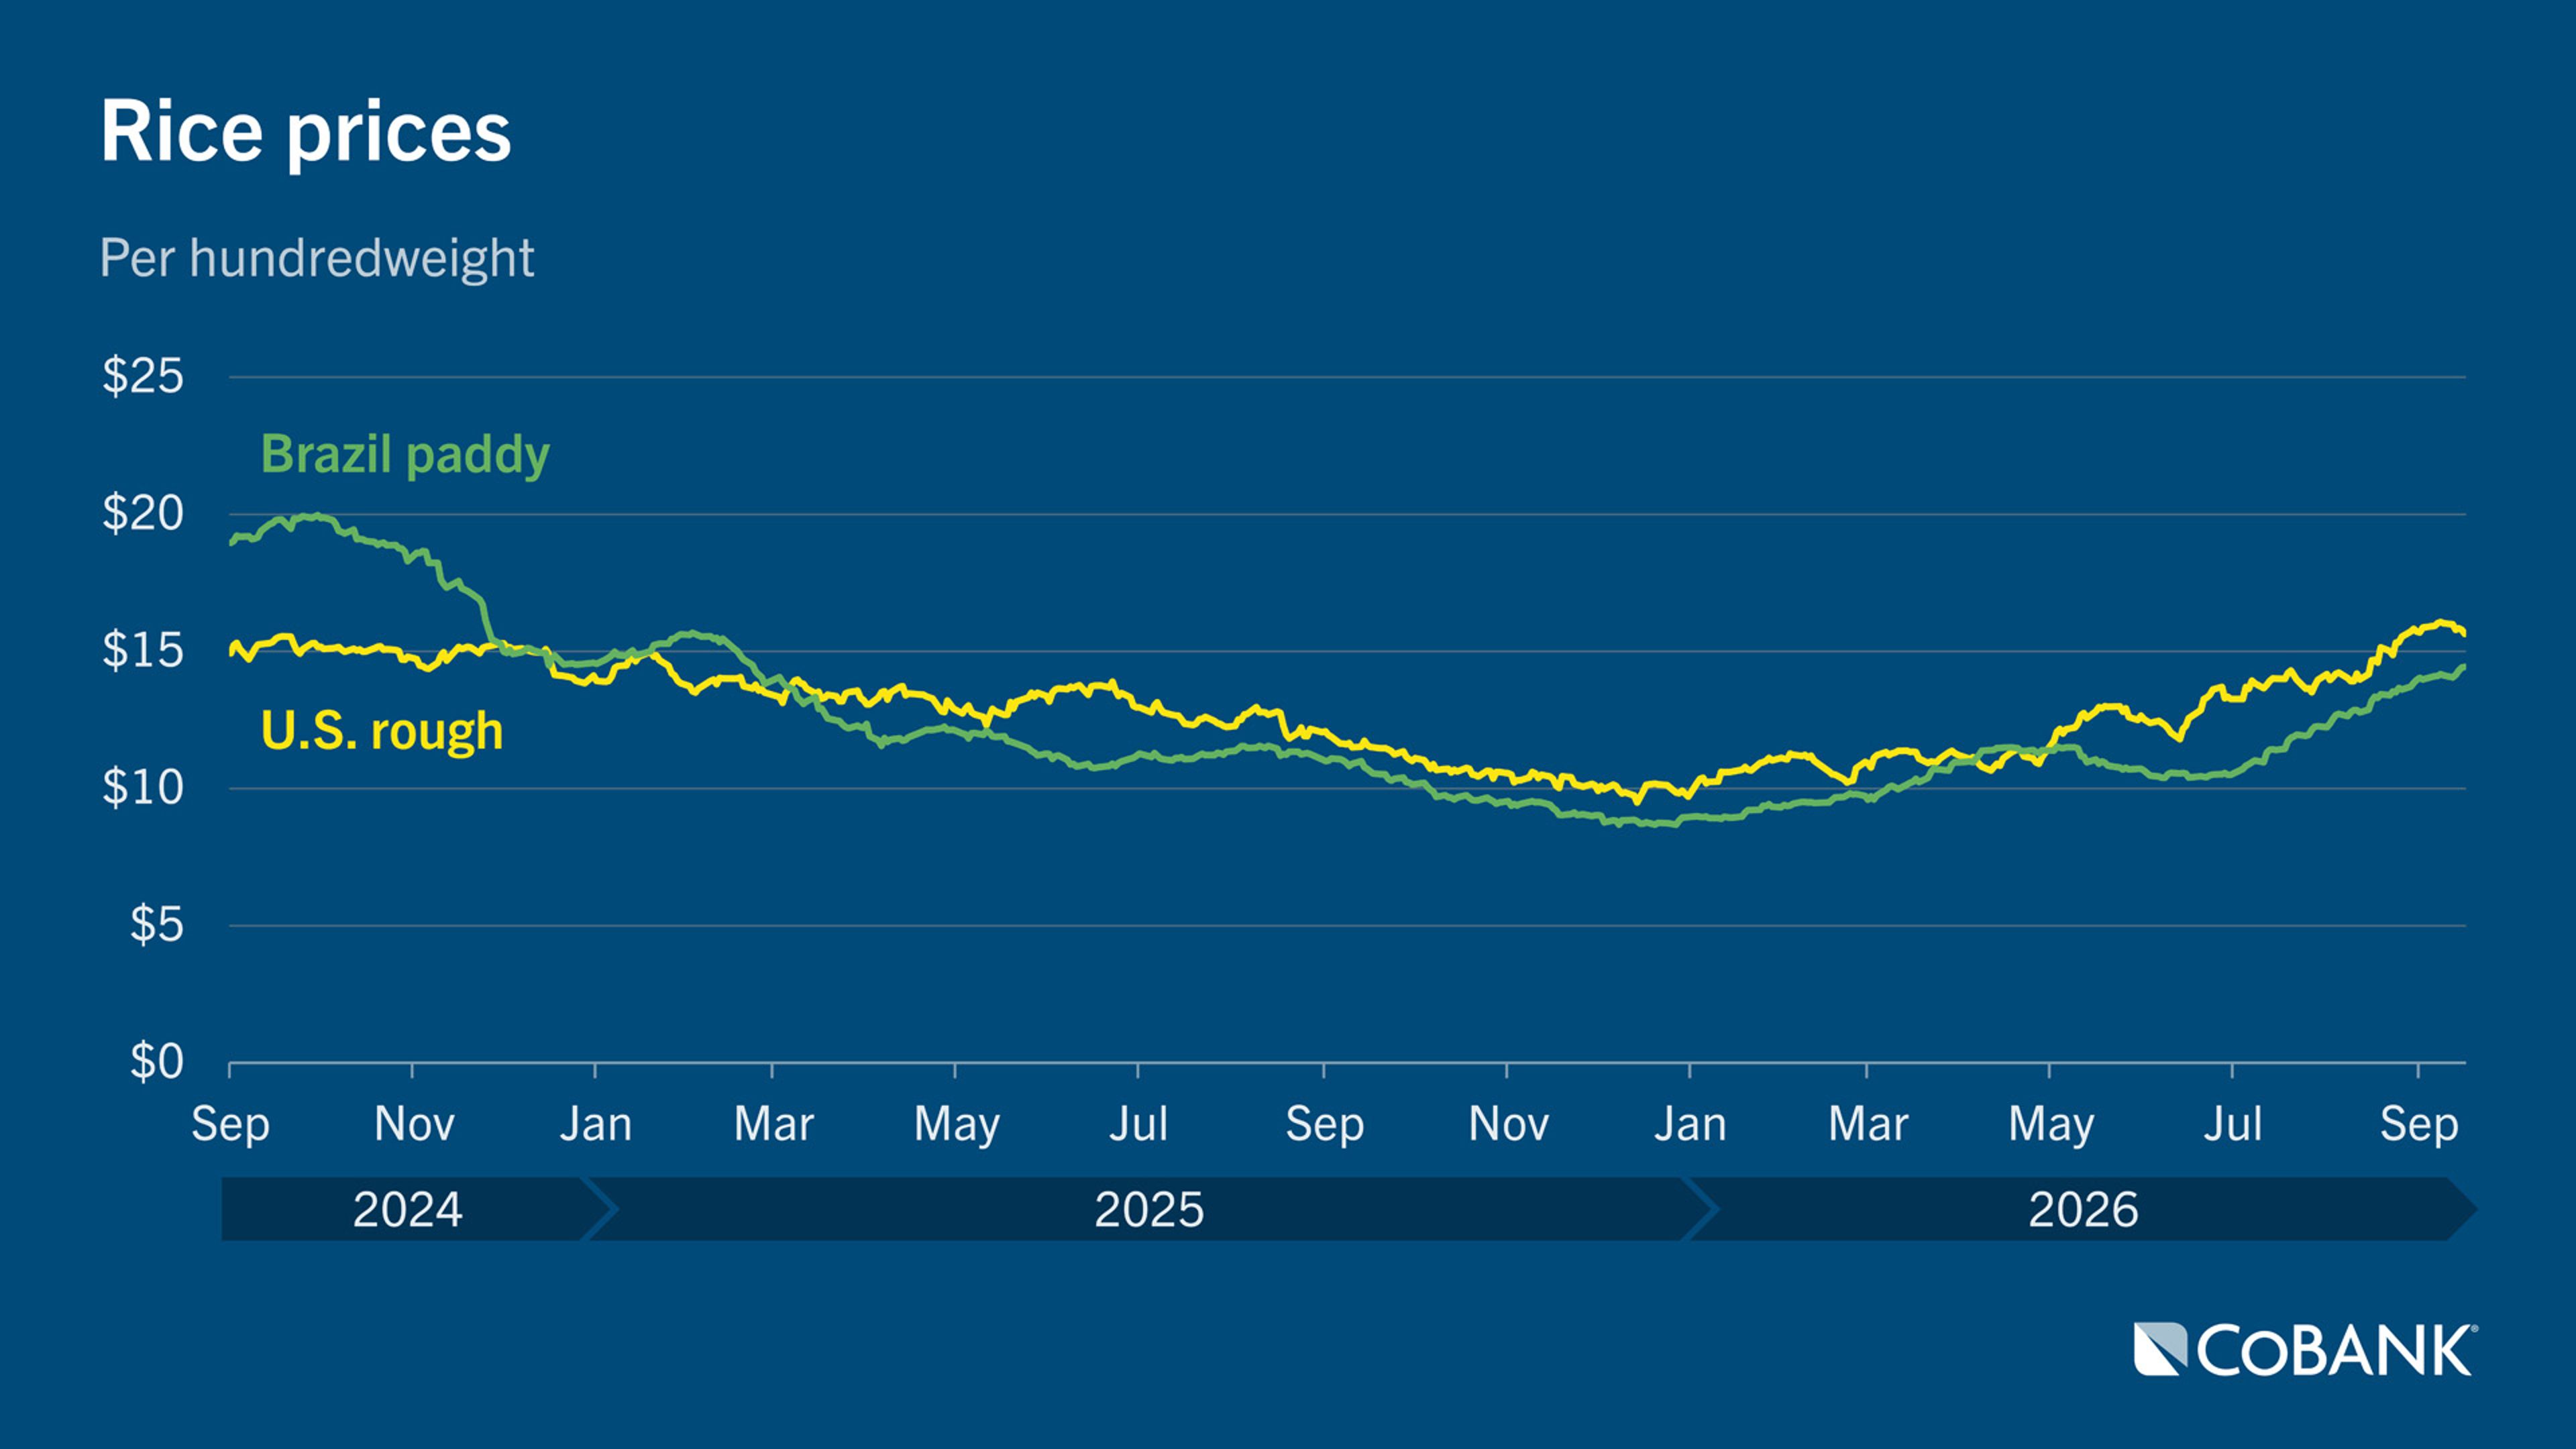
Rice prices responded to sharply tighter supplies, with rough rice futures at the end of the quarter up 41% YoY. Large carryover stocks from last year’s bigger harvest will provide a needed supply buffer for long-grain rice millers.
Concerns are growing that farmers in Brazil — the top U.S. export competitor in rice — will reduce acreage this fall as USDA predicts a 6% YoY drop. A historically strong El Niño adds uncertainty to Brazil’s rice outlook. Brazilian paddy rice prices have followed the rally in U.S. rough rice as Brazilian farmers hold supplies in anticipation of higher prices.
Buyers fear global supplies will tighten next quarter amid smaller harvests in India and Southeast Asia as El Niño causes below-normal rainfall and hotter growing conditions across key rice-producing regions.
Sugar
Despite rising sugar imports into the U.S., sugar prices climbed last quarter to their highest level in 19 months because of robust sugar deliveries and tightening production prospects. Sugar beet plantings fell to their lowest level since 1950 with freezing temperatures and drought conditions crimping yields. Meanwhile, pasture mealybug infestations have lowered production expectations for sugarcane growers in Florida. USDA forecasts 2026-27 U.S. sugar production at 8.84 million tons, the lowest since 2019-20.
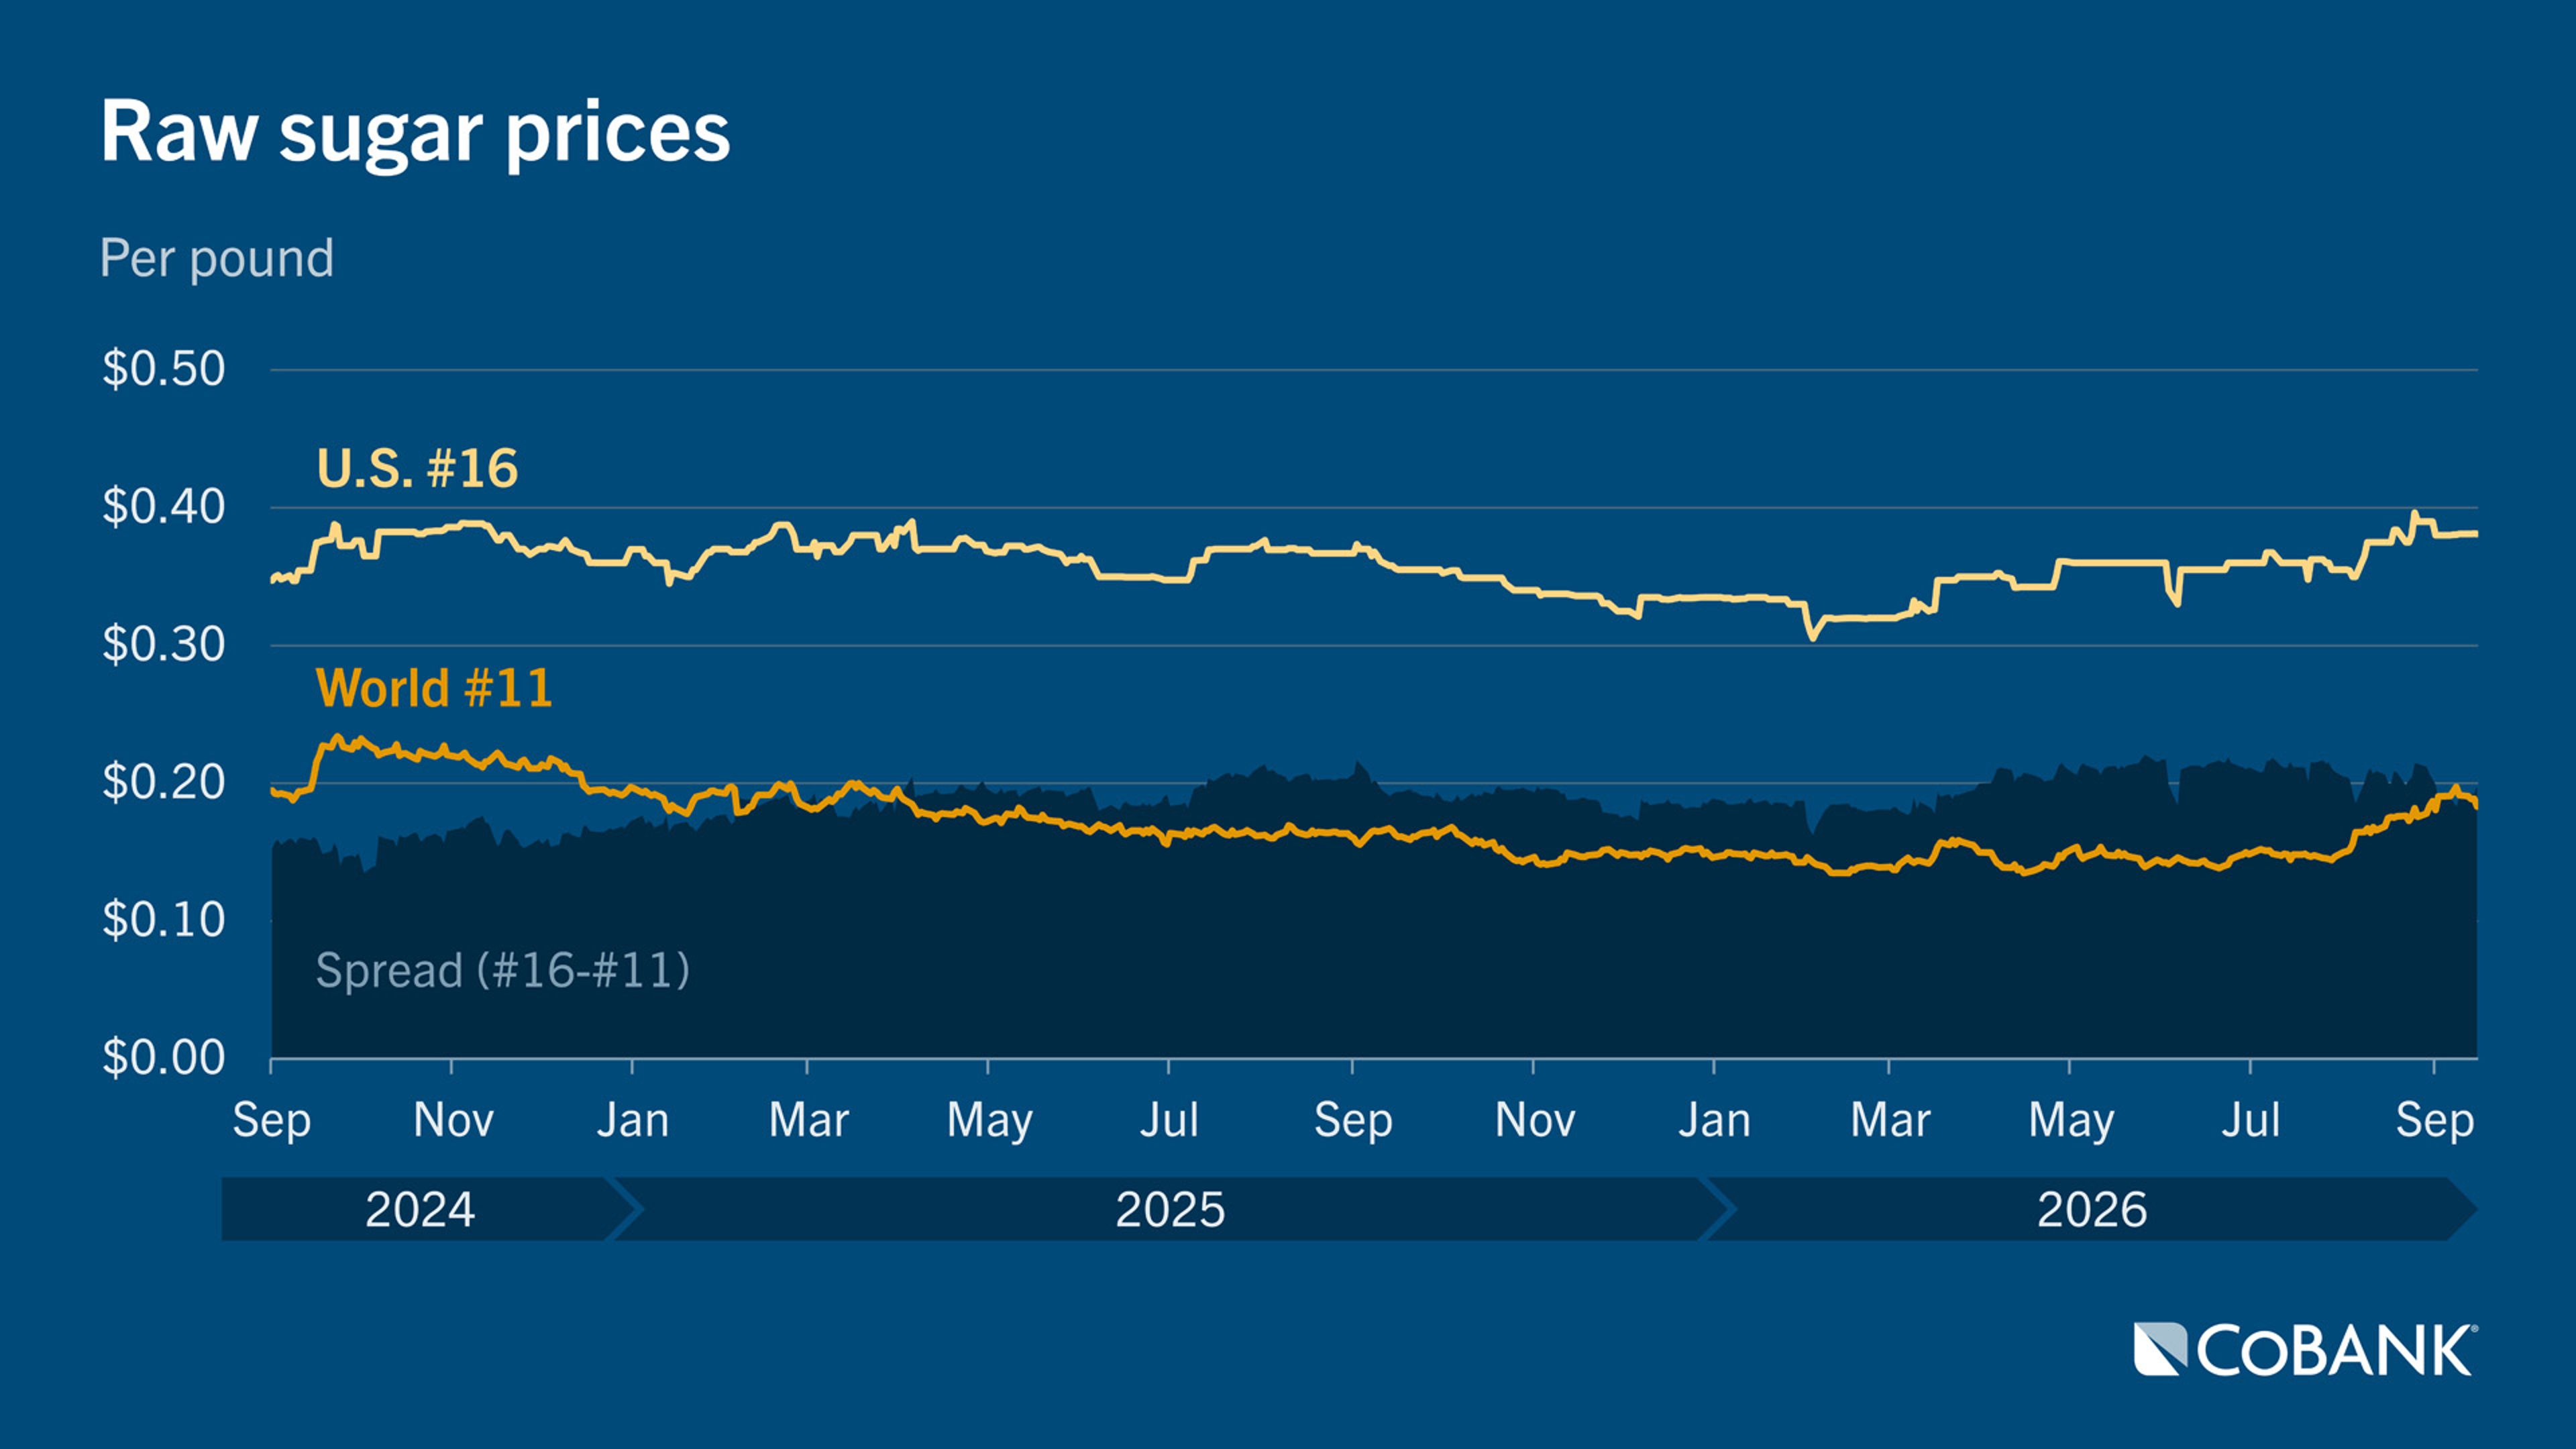
The widening spread between No. 16 U.S. raw sugar prices and the cheaper No. 11 world raw sugar contract continues to pull imports into the U.S. despite long-standing Tier 2 tariffs on out-of-quota sugar. The out-of-quota tariffs, set at 15.36 cents per pound for raw cane sugar and 16.21 cents per pound for refined sugar, were last updated in 2000.
Disclaimer: The information provided in this report is not intended to be investment, tax, or legal advice and should not be relied upon by recipients for such purposes. The information contained in this report has been compiled from what CoBank regards as reliable sources. However, CoBank does not make any representation or warranty regarding the content, and disclaims any responsibility for the information, materials, third-party opinions, and data included in this report. In no event will CoBank be liable for any decision made or actions taken by any person or persons relying on the information contained in this report.