Fertilizer markets struggle with supply constraints, farmer affordability
Key points
- Growers will need to replenish potash and phosphate levels in soil to avoid lower crop yields next year.
- Lack of global fertilizer supply is constraining demand in the near term.
- Government aid to farmers will not resolve supply-and-demand challenges but may ease the pain of elevated prices.
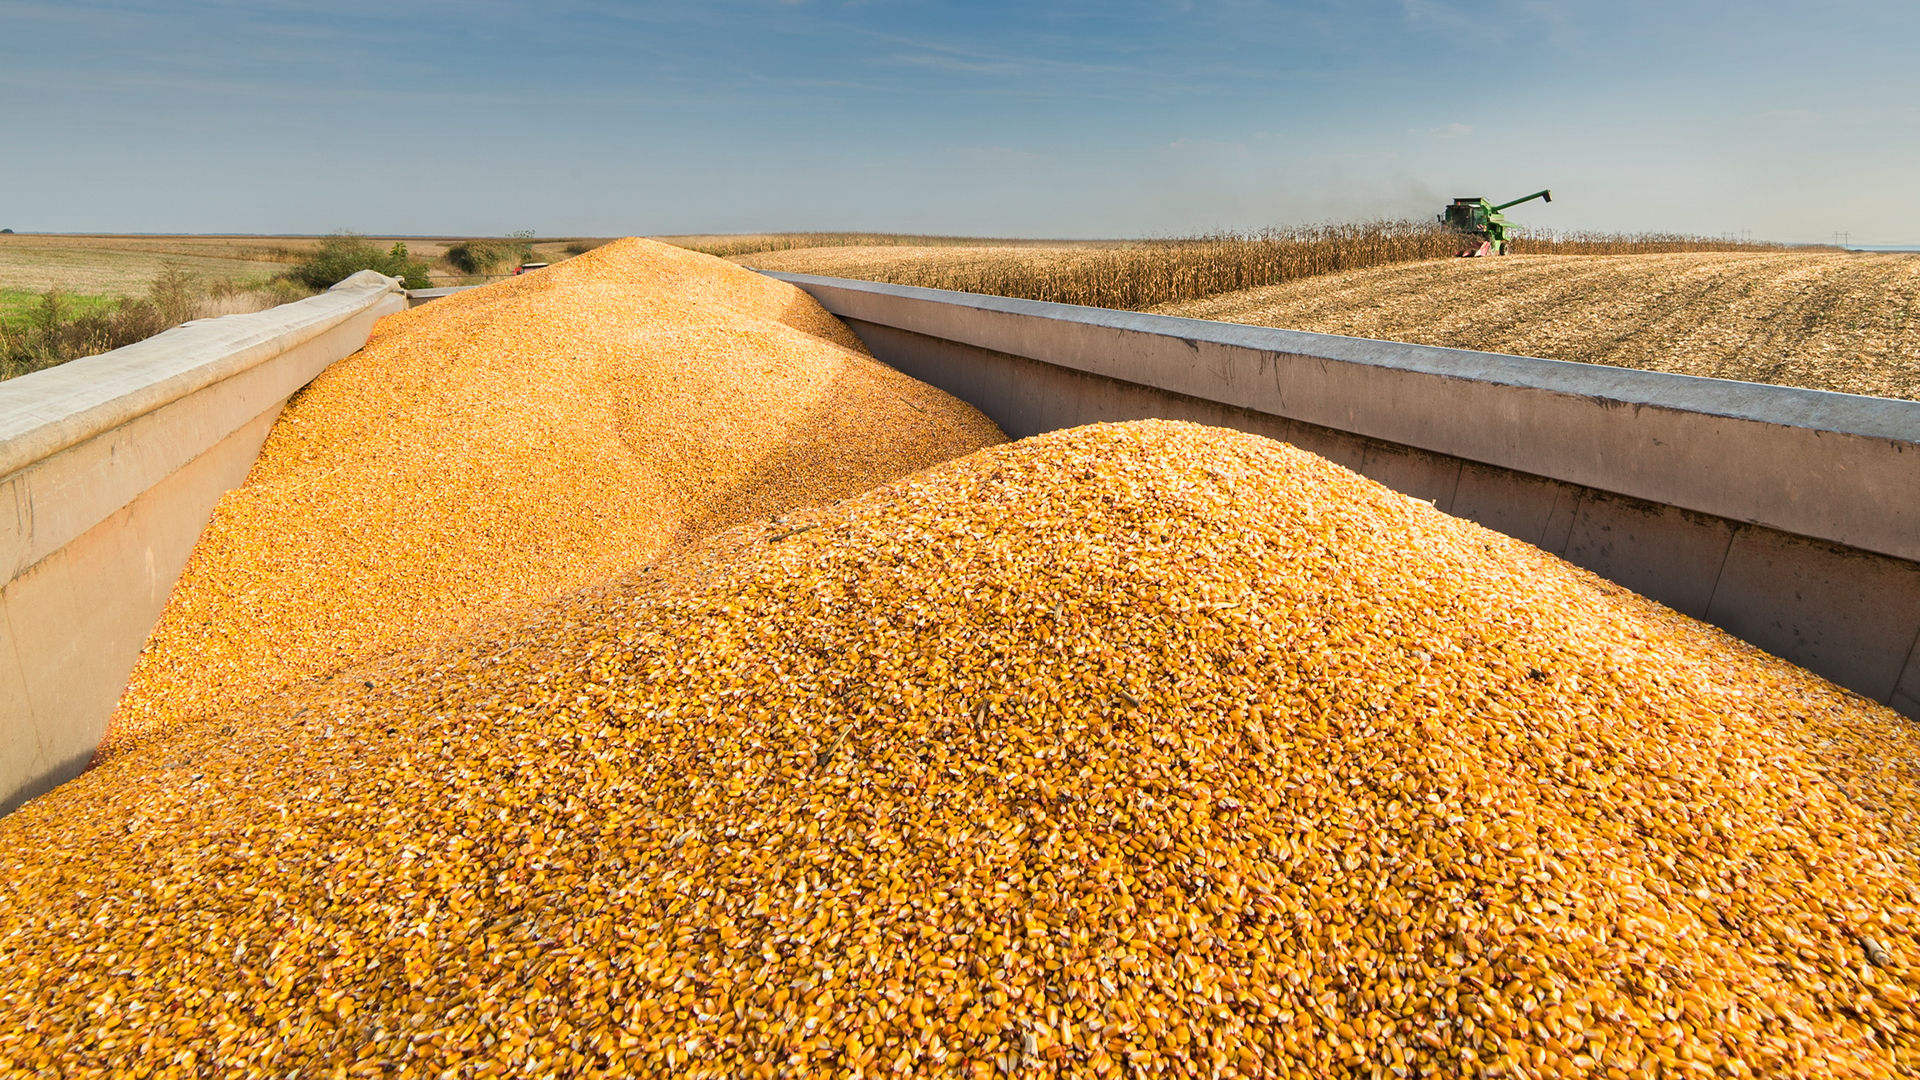
Facing another year of tight crop margins and slightly flat to lower crop input prices, farmers will be looking to produce their way to higher profits as they evaluate inputs for the 2026 crop year. The large 2025 harvest depleted phosphate and potash from the soil, which must be restored to maintain next year's productivity and yield. Accordingly, fertilizer producers project higher nitrogen volumes for 2026, while potash volumes are expected to remain consistent with last year's levels and phosphate volumes may experience a slight decline.
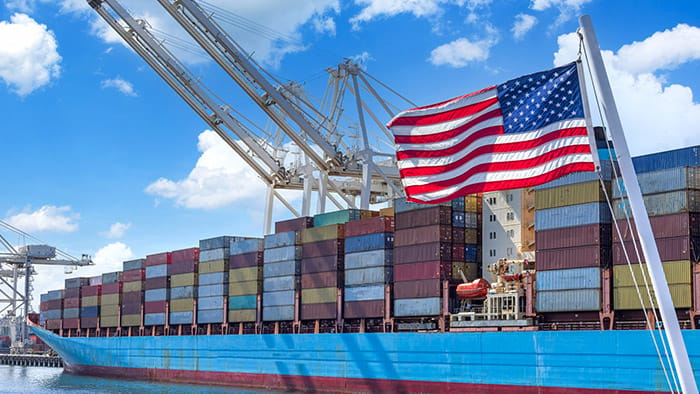
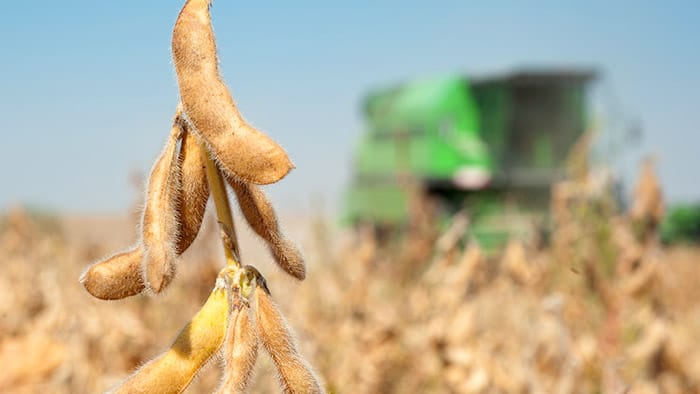
Favorable fall weather allowed for normal fall fertilizer applications. However, growers in the United States and Brazil have adopted a cautious approach to seasonal purchasing, resulting in moderated pricing and influencing the timing of sales volumes. The slight recovery of corn and soybean prices should encourage more fertilizer activity, particularly if China lives up to its promises of purchasing U.S. soybeans and wheat. Additional direct government aid to farmers announced in December could provide further support for U.S. fertilizer demand and avoid significant application reductions.
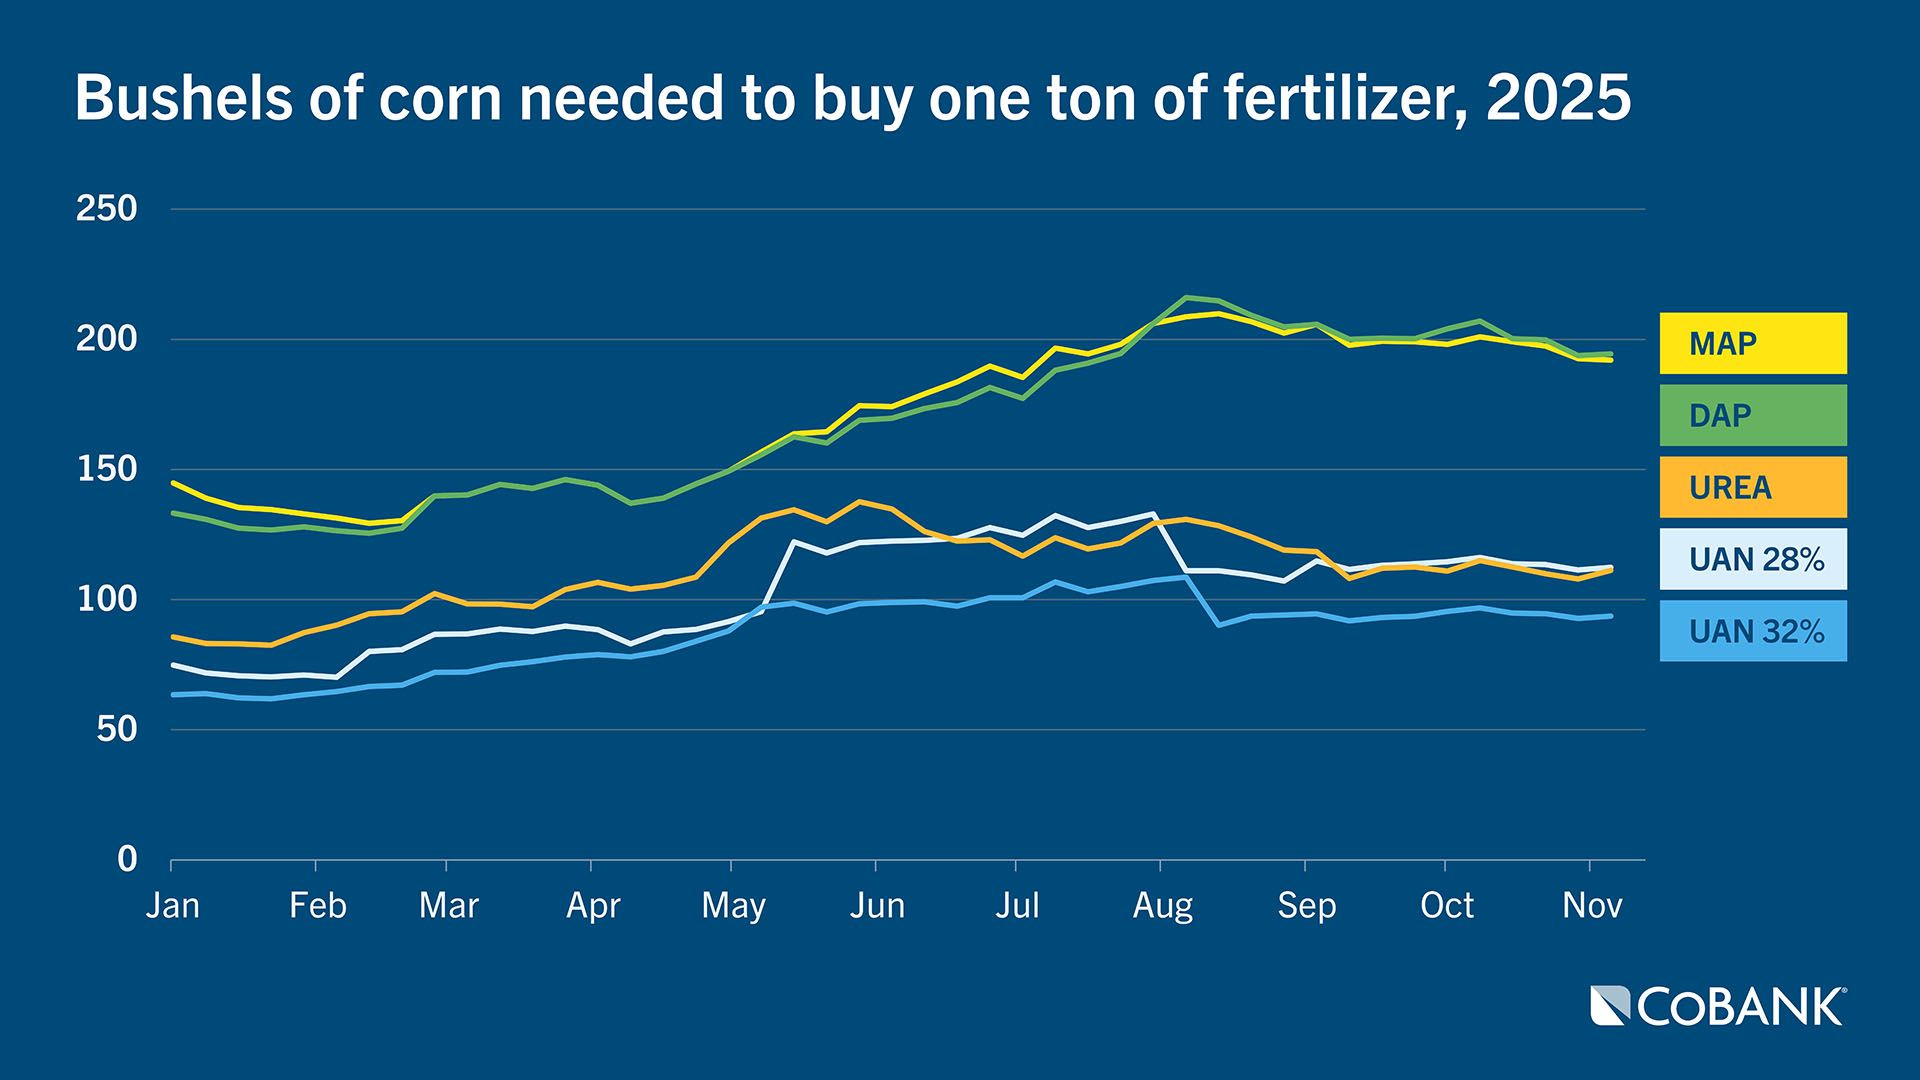
The Economic Research Service reports that relative to historical averages in 2010–19, in 2022 fertilizer costs per acre were 110% higher for corn and 141% higher for wheat. Though fertilizer prices have dropped since the end of 2022 (when they were driven by the Ukraine-Russia conflict), the cost to buy fertilizer as compared to the price for a bushel of corn shows the delicate balance required as farmers evaluate application levels for 2026.
Farmer affordability remains under pressure considerably from levels in early 2020. Although corn prices have slid, the price of fertilizers has not. This means more bushels of corn must be produced to buy one ton of fertilizer as producers aim to offset lower profitability.
The Fertilizer Institute noted that currently, 65% of overall U.S. farmers’ nitrogen, phosphate and potash needs are met by domestic fertilizer production. The rest comes from imports, which increasingly have been impacted by geopolitical uncertainty. For two of the three macronutrients—nitrogen and phosphate—the U.S. has significant resources and abundant production capacity. Canada has the largest reserves of potash, while U.S. potash reserves are miniscule. Meanwhile, Russia is the No. 1 supplier of urea and urea and ammonium nitrate (UAN) to the U.S., and the second-leading supplier of potash.
The exemption of fertilizer from reciprocal tariffs by the Trump administration in mid-November was positively received, as it should help mitigate additional price escalation. Summer fill prices were nearly $100 higher per ton, even without a major impact from tariffs. Potash was largely exempted from International Emergency Economic Powers Act tariffs, especially as 87% of potash imports come from Canada. Potash prices in the U.S. and Canada moved in parallel the last two years, whereas the lack of tariff exemptions created increases for MAP, DAP and urea. Comparing U.S.–Canada price spreads before and after the tariffs shows that the relative price gap widened, with some U.S. farmers paying up to $34 per metric ton more for DAP, $32 more for MAP, and $11 more for urea, the North Dakota State University Trade Monitor reported.
Supply and demand driving market fundamentals
Potash markets are balanced as affordability drives demand around the world, particularly in China and Southeast Asia. Large soil nutrient removal from a record crop and channel inventories at average or at below-average levels in most major markets support strong demand heading into next year.
Global nitrogen supply challenges reinforce a tight supply and demand balance going into 2026. Ammonia markets are currently very constrained due to plant outages and project delays. The emergence of seasonal demand may further tighten urea market fundamentals. Anhydrous ammonia demand is expected to remain steady, as nitrogen plays a necessary role in crop nutrient profiles. Corn acreage is anticipated to remain high in 2026, extending additional demand for nitrogen.
Despite coming off recent highs, phosphate prices remain elevated compared to historical average levels, and affordability pressure remains a concern. Phosphate markets remain tight as global supply constraints persist. Chinese exports of phosphate are expected to remain restricted due to China’s higher domestic use. In 2025, China—typically the world's largest phosphate exporter—reduced its phosphate exports by 18%, totaling over 1 million tonnes. Total reductions could reach over 1.5 million tonnes. The economics heading into 2026 support further demand growth but depend on improving supply. Continued growth in lithium iron phosphate battery demand and rising domestic fertilizer demand in China are likely to further erode Chinese exports and limit new capacity additions over the next few years.
The listing of phosphate and potash as critical minerals will help streamline the permitting process for expanding and opening mines in the years ahead, but supply constraints will still linger.
Overall, potash and phosphate demand should benefit from the strong yields U.S. and Brazilian farmers generated in 2025, along with the need to replenish soil and help minimize income losses in 2026.
Disclaimer: The information provided in this report is not intended to be investment, tax, or legal advice and should not be relied upon by recipients for such purposes. The information contained in this report has been compiled from what CoBank regards as reliable sources. However, CoBank does not make any representation or warranty regarding the content, and disclaims any responsibility for the information, materials, third-party opinions, and data included in this report. In no event will CoBank be liable for any decision made or actions taken by any person or persons relying on the information contained in this report.