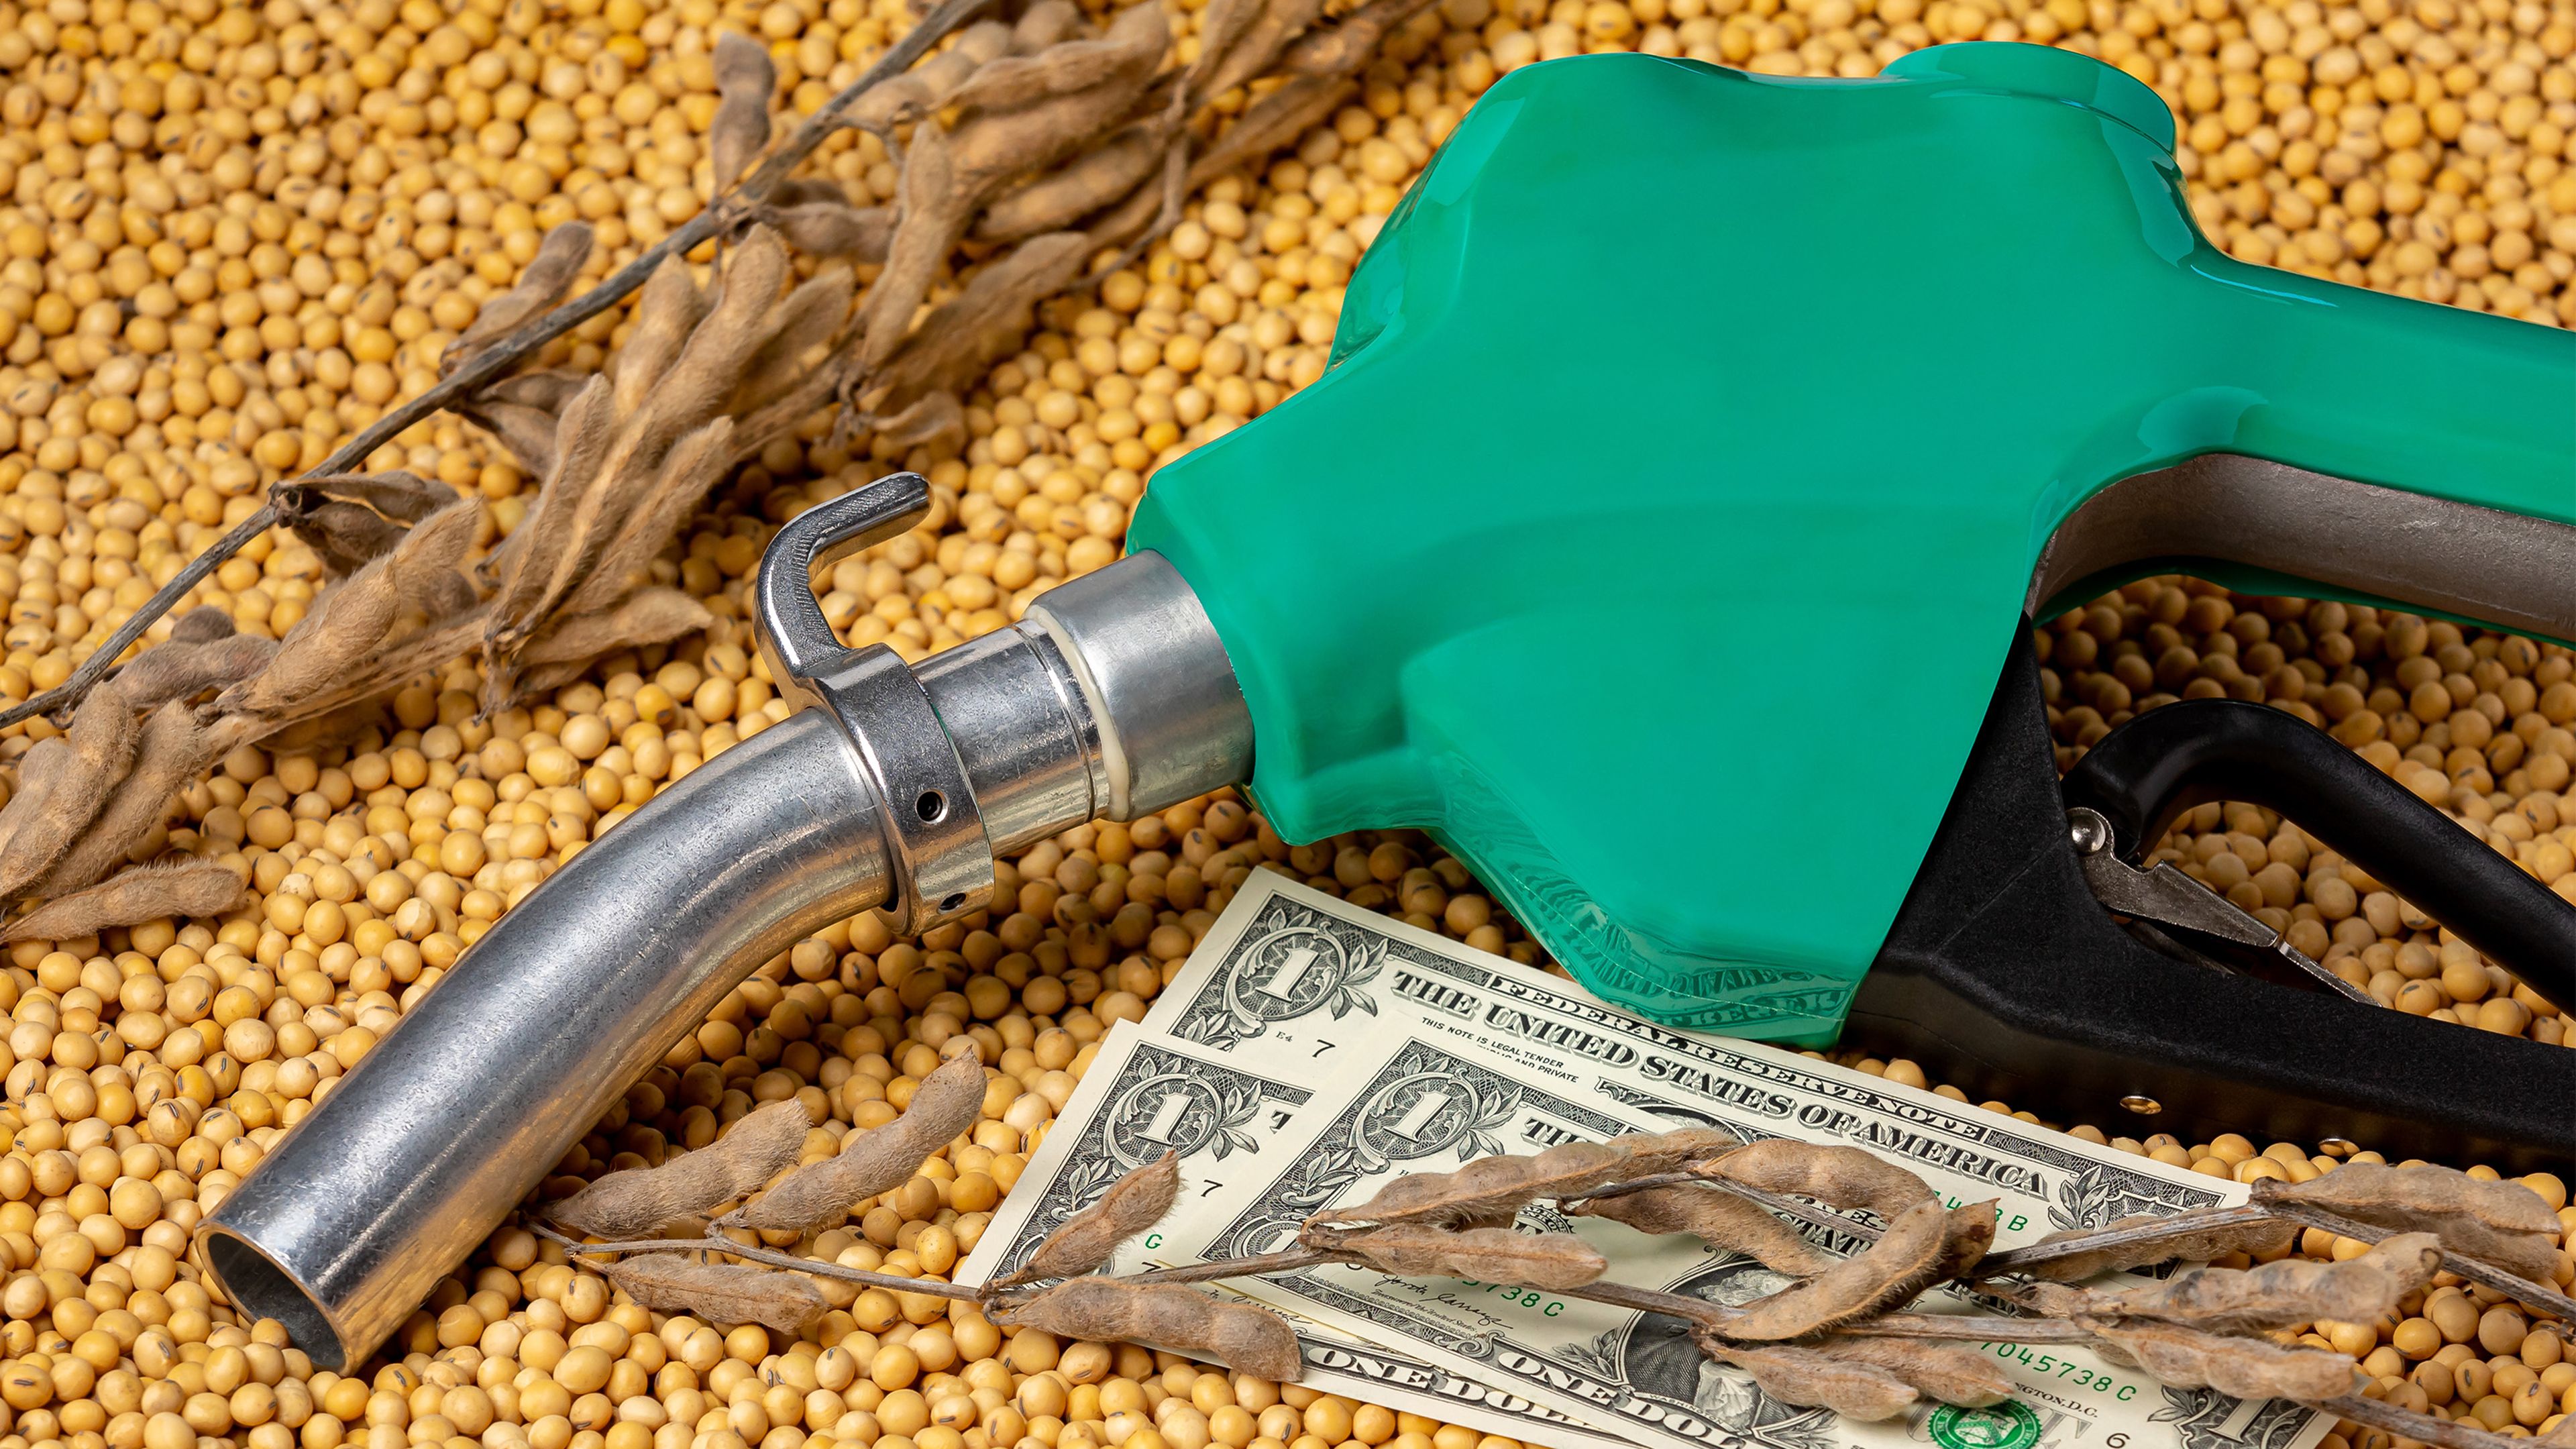
Soybean processors see record crush margins on surging soyoil prices

Key points
- U.S. farmers shied away from planting corn amid higher input costs and low corn prices.
- U.S. soybean crush accelerated to new records, which has helped prop up prices despite the lack of Chinese demand.
- U.S. wheat planted acreage fell to a record low as drought and freeze damage pushed winter wheat abandonment rates higher.
Corn
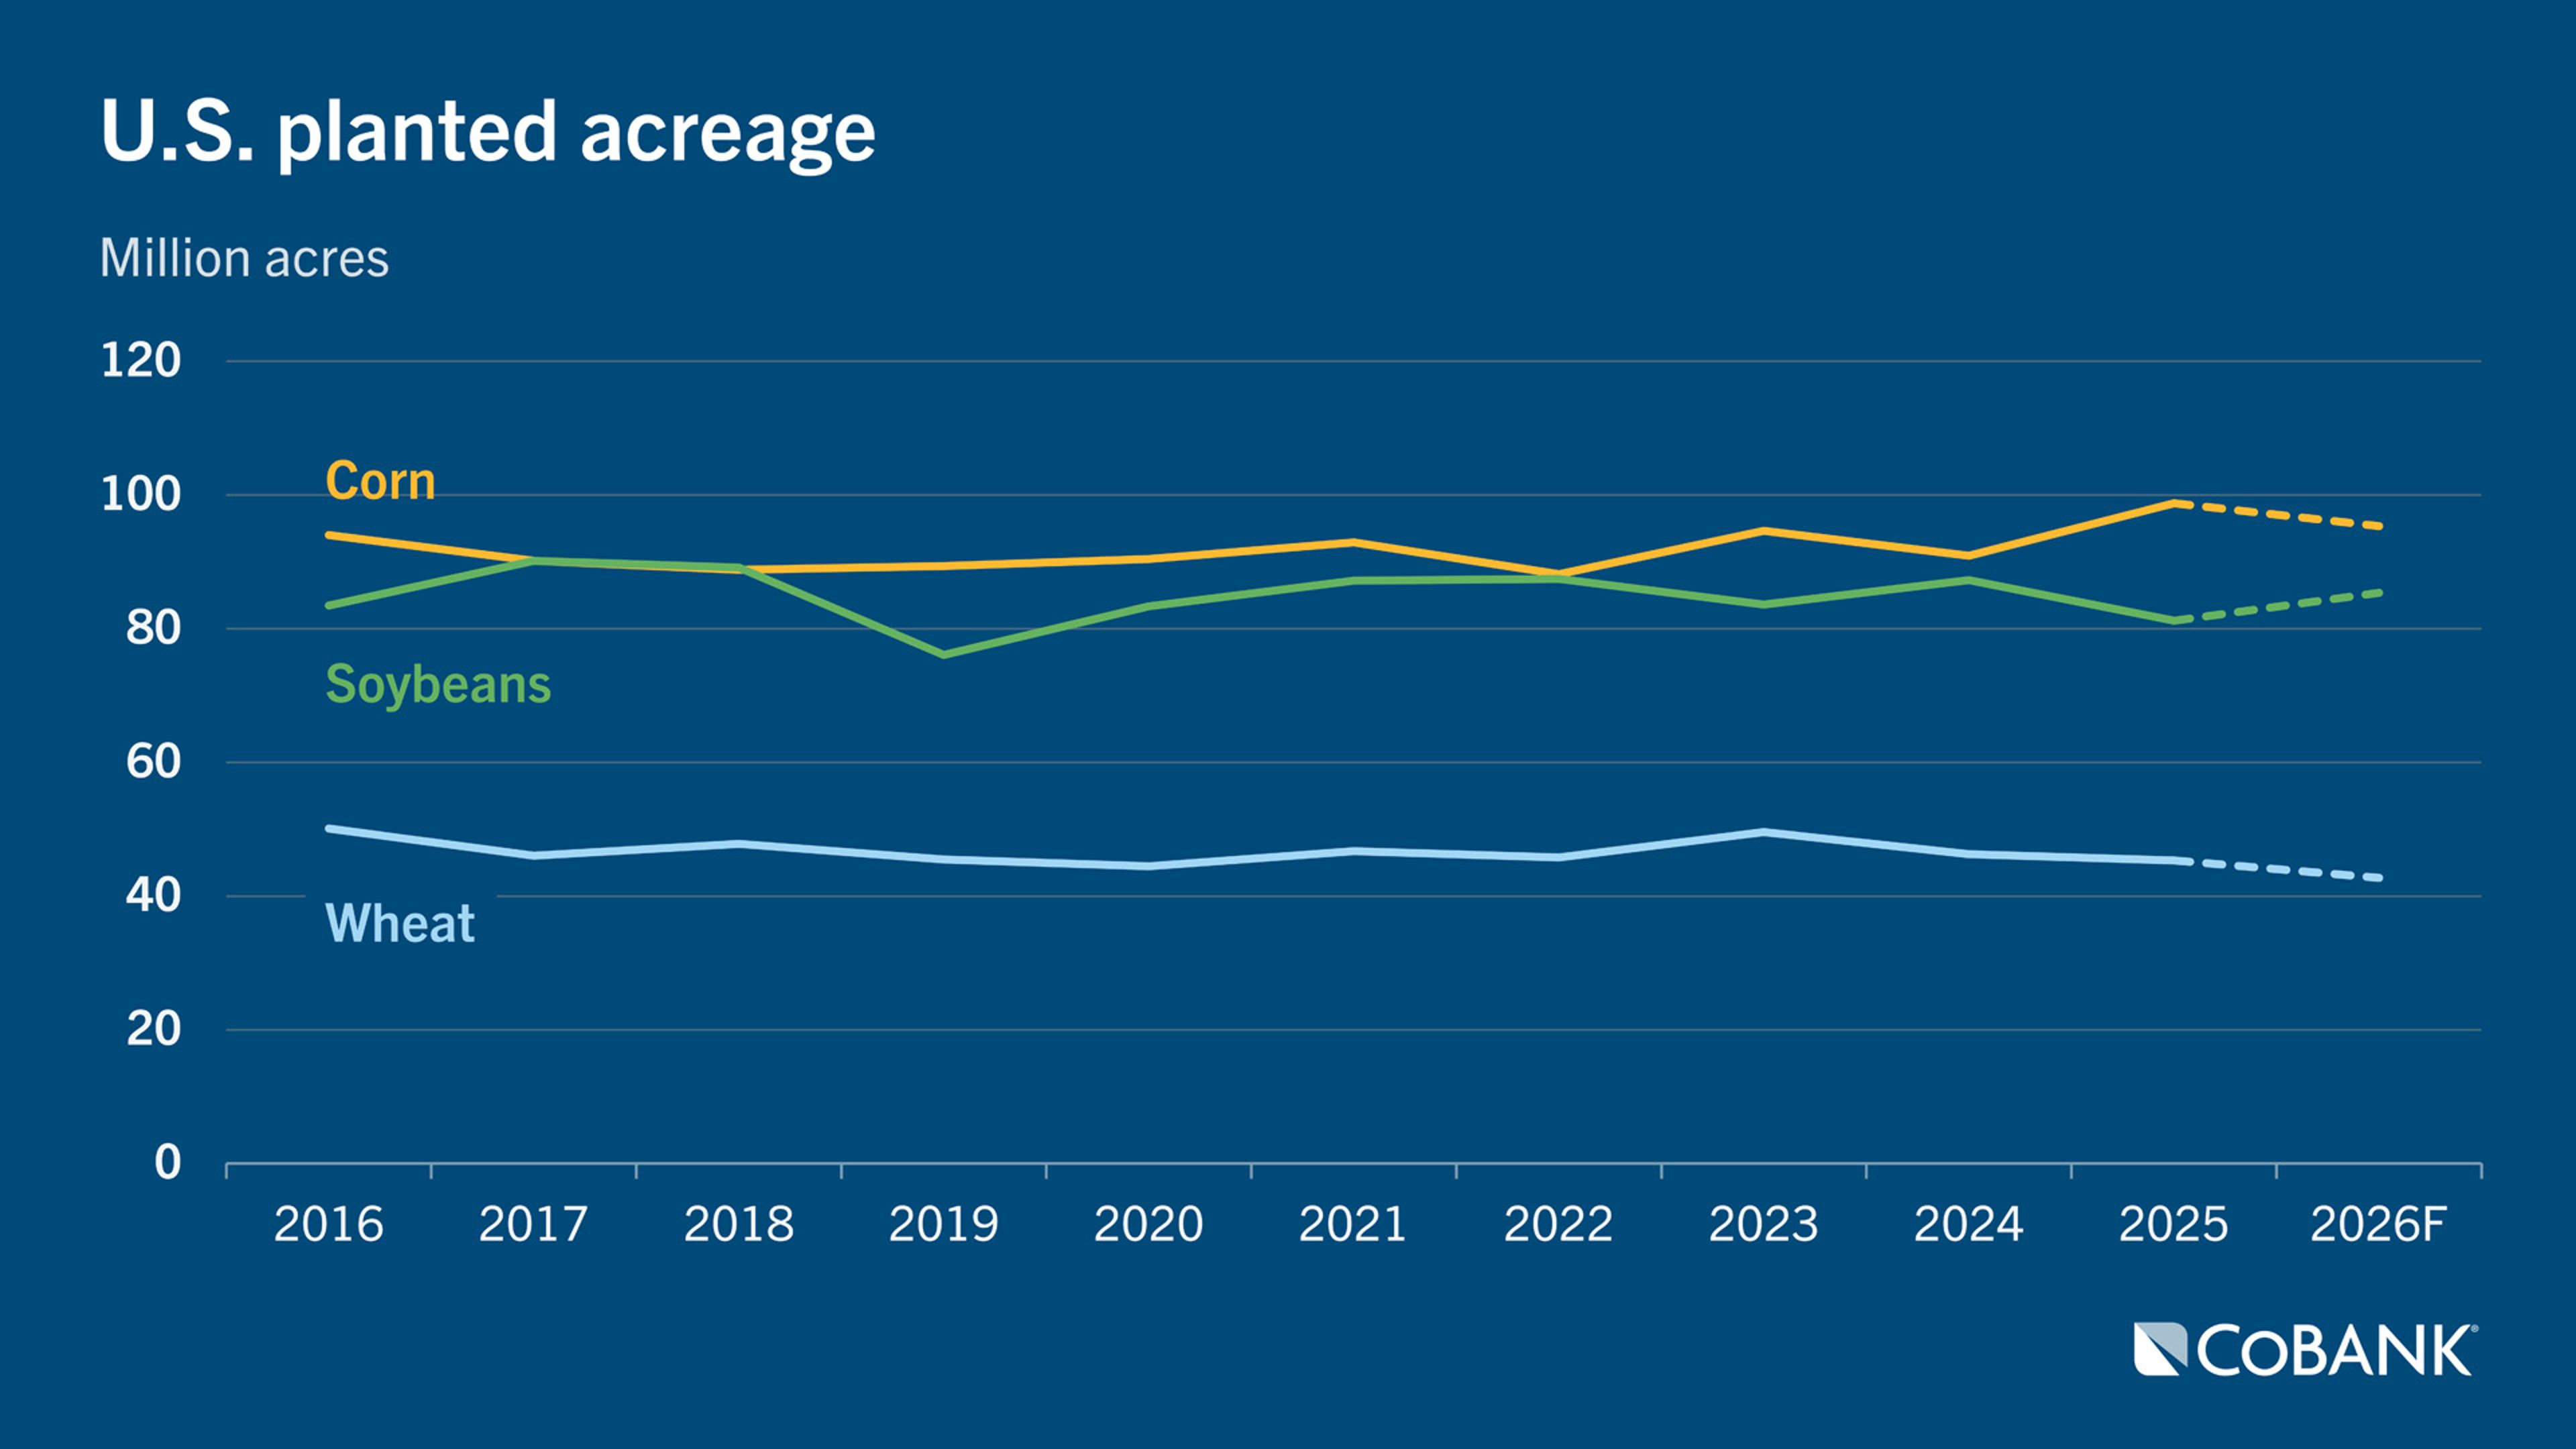
U.S. farmers became more wary of planting corn this spring amid low corn prices and higher costs of fertilizer and other inputs. USDA estimated U.S. corn planted acreage at 95.3 million acres, down 3.5% year-over-year and virtually unchanged from what farmers previously indicated in March.
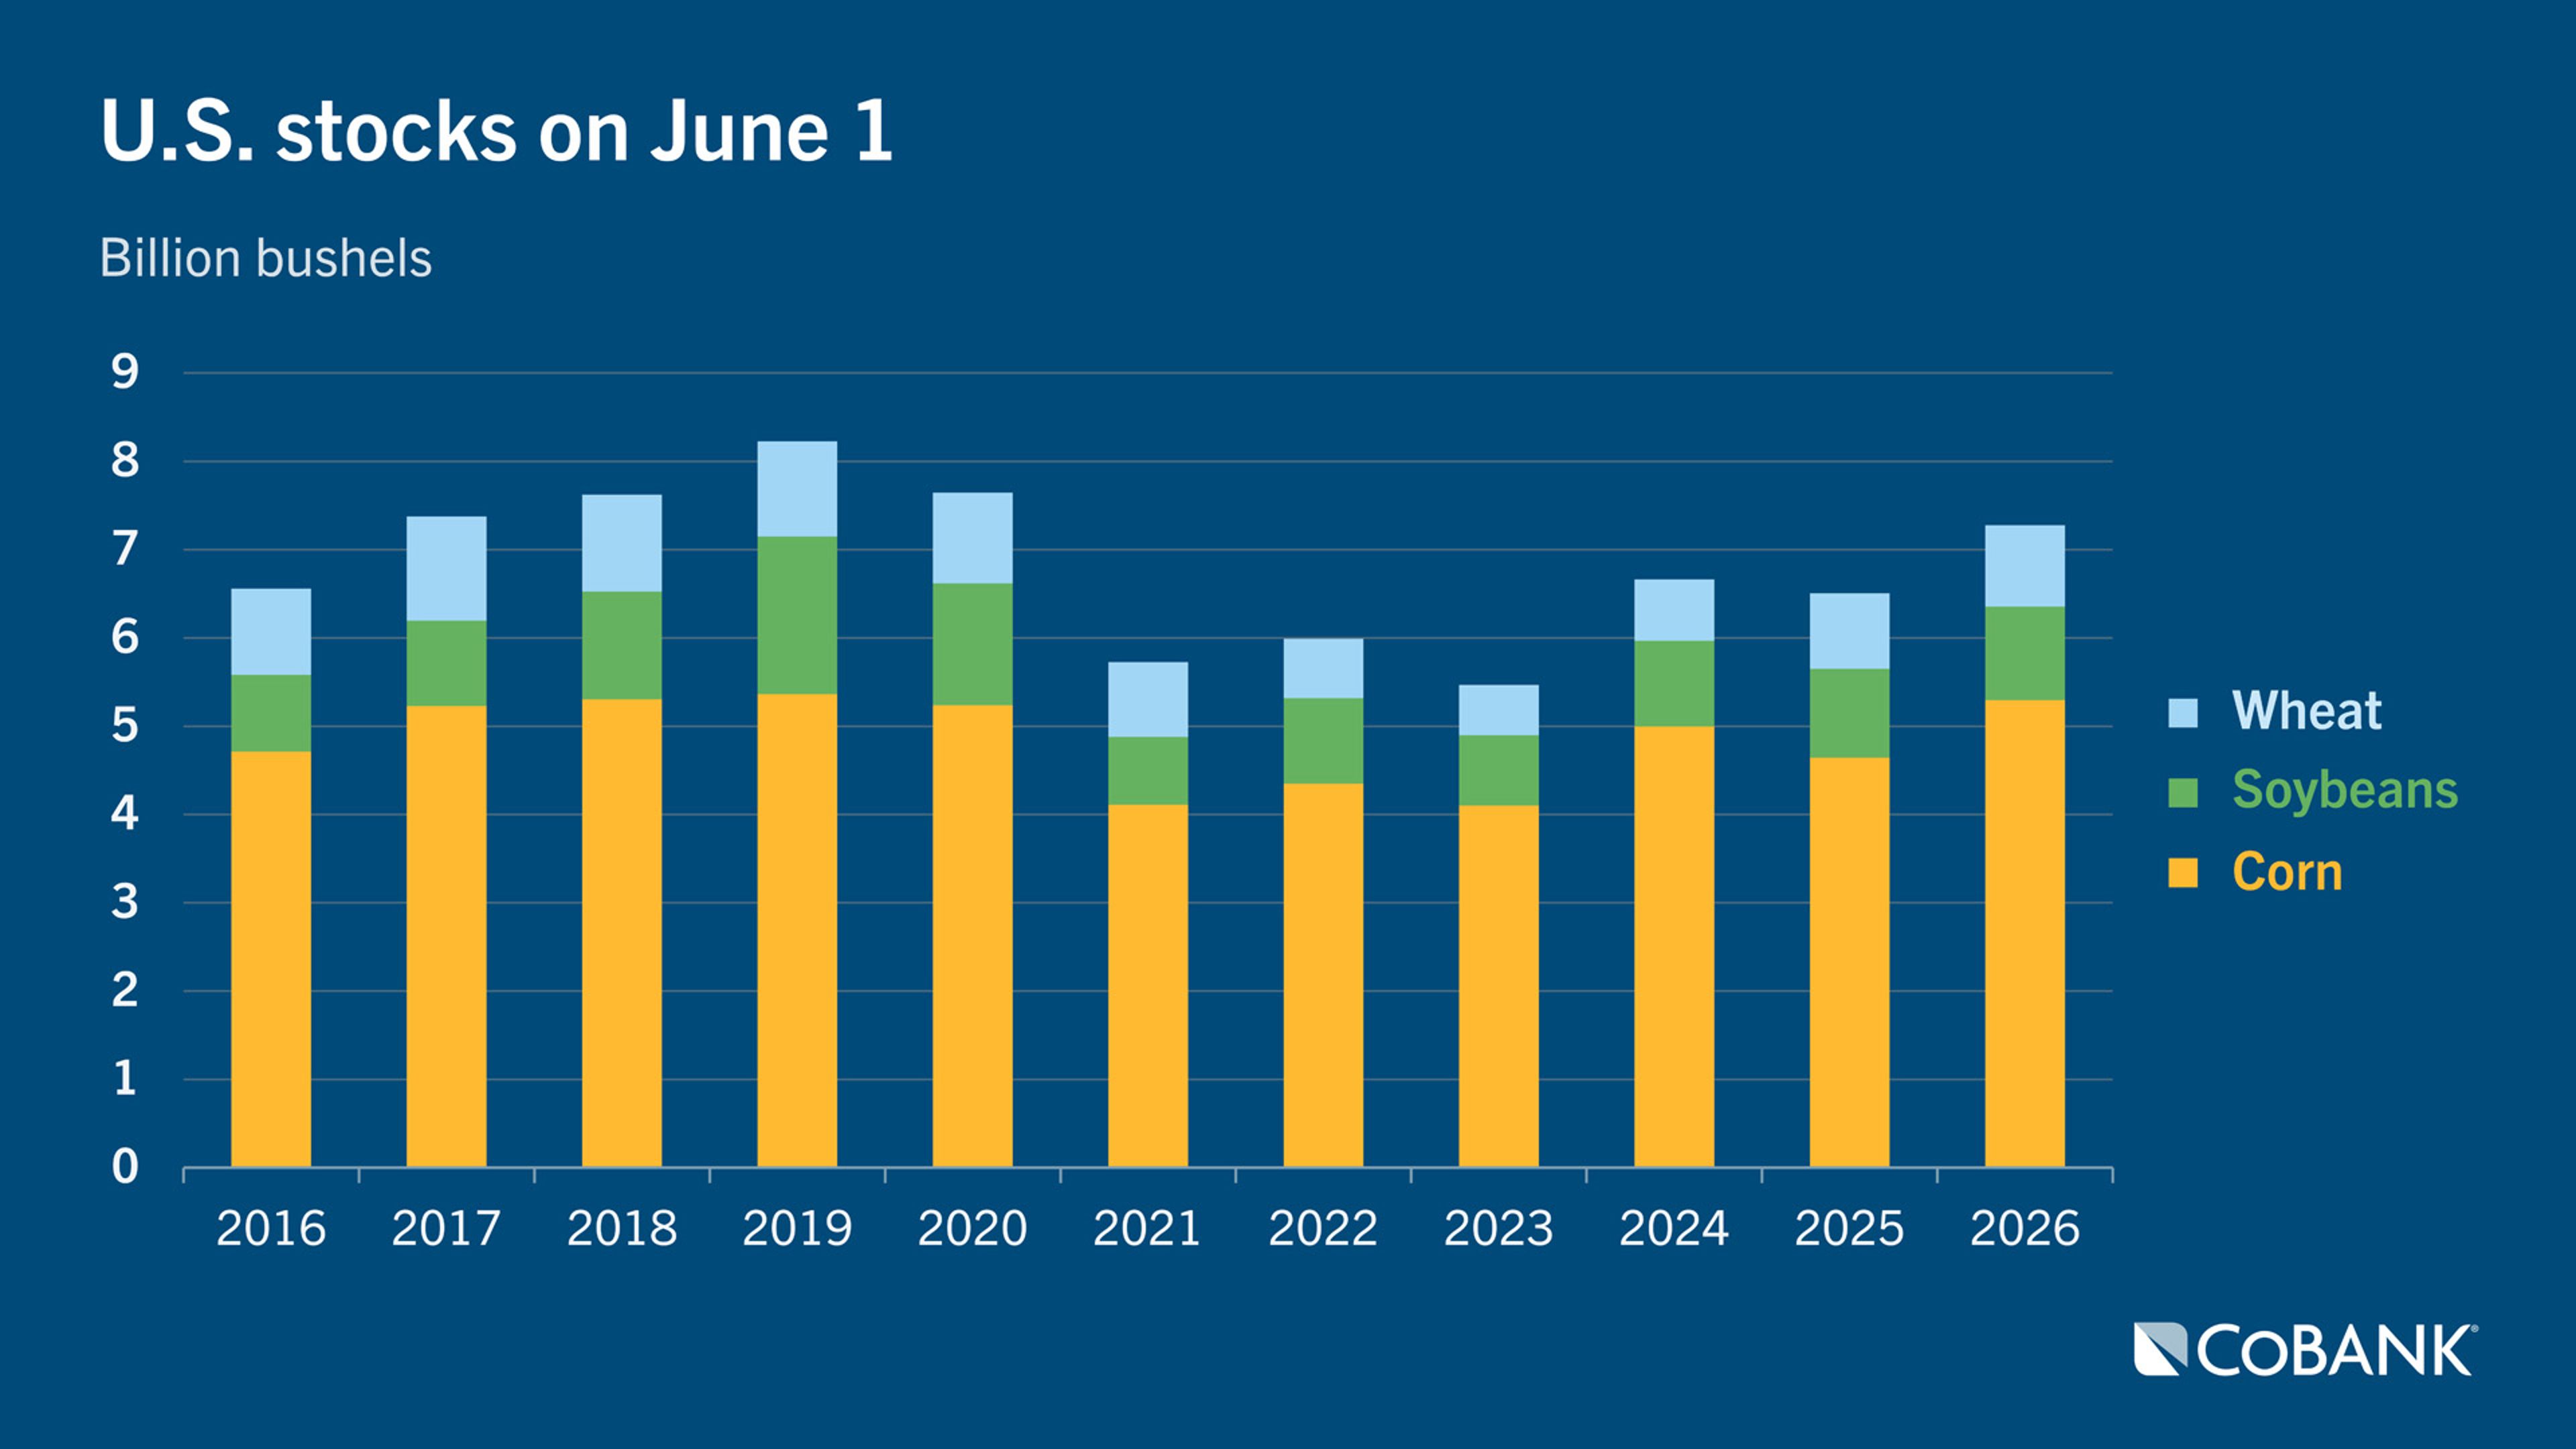
Extreme heat in the U.S. Corn Belt has raised concerns of a smaller corn harvest this fall with yield prospects declining as the crop enters the vulnerable pollination phase. The futures spread between old-crop and new-crop corn contracts has narrowed considerably, further reflecting the market’s concern over a smaller 2026 harvest. Ample U.S. corn inventories on June 1, which were up 14.0% YoY, will add supply cushion in the 2026/27 crop year starting Sept. 1.
Corn’s usage pace, meanwhile, shows no signs of slowing with exports holding a record pace. Shipments for the current marketing year are up 25.2% YoY. Feed demand in the last quarter was also stronger than expected while corn used for ethanol is up slightly.
Corn’s role as a biofuel feedstock has been hindered by grain sorghum’s fast growth. Ethanol plants have doubled their usage of grain sorghum in the past year thanks to plentiful supplies stranded in the U.S. following China’s boycott of U.S. agricultural exports last fall. The aggressive usage of sorghum and return of Chinese demand, though, is dwindling stocks, portending a potential shift back to using more corn for ethanol.
Corn prices fell 3.2% through the quarter, pressured by a strengthening U.S. dollar and declining oil prices as the war in the Middle East draws nearer to conclusion. Adequate moisture and mild temperatures across much of the Corn Belt also pressured prices early in the quarter. But weather during corn’s key reproductive phases of silking and pollination in July will be what ultimately determines yield and crop size. If corn conditions start to slip due to extreme heat or a lack of precipitation, markets could provide a summer rally.
Soybeans
Since EPA finalized the renewable volume obligation (RVO) in March, surging soybean oil prices have sent crush margins for soybean processors to record highs and lifted the U.S. crush pace to breakneck speed.
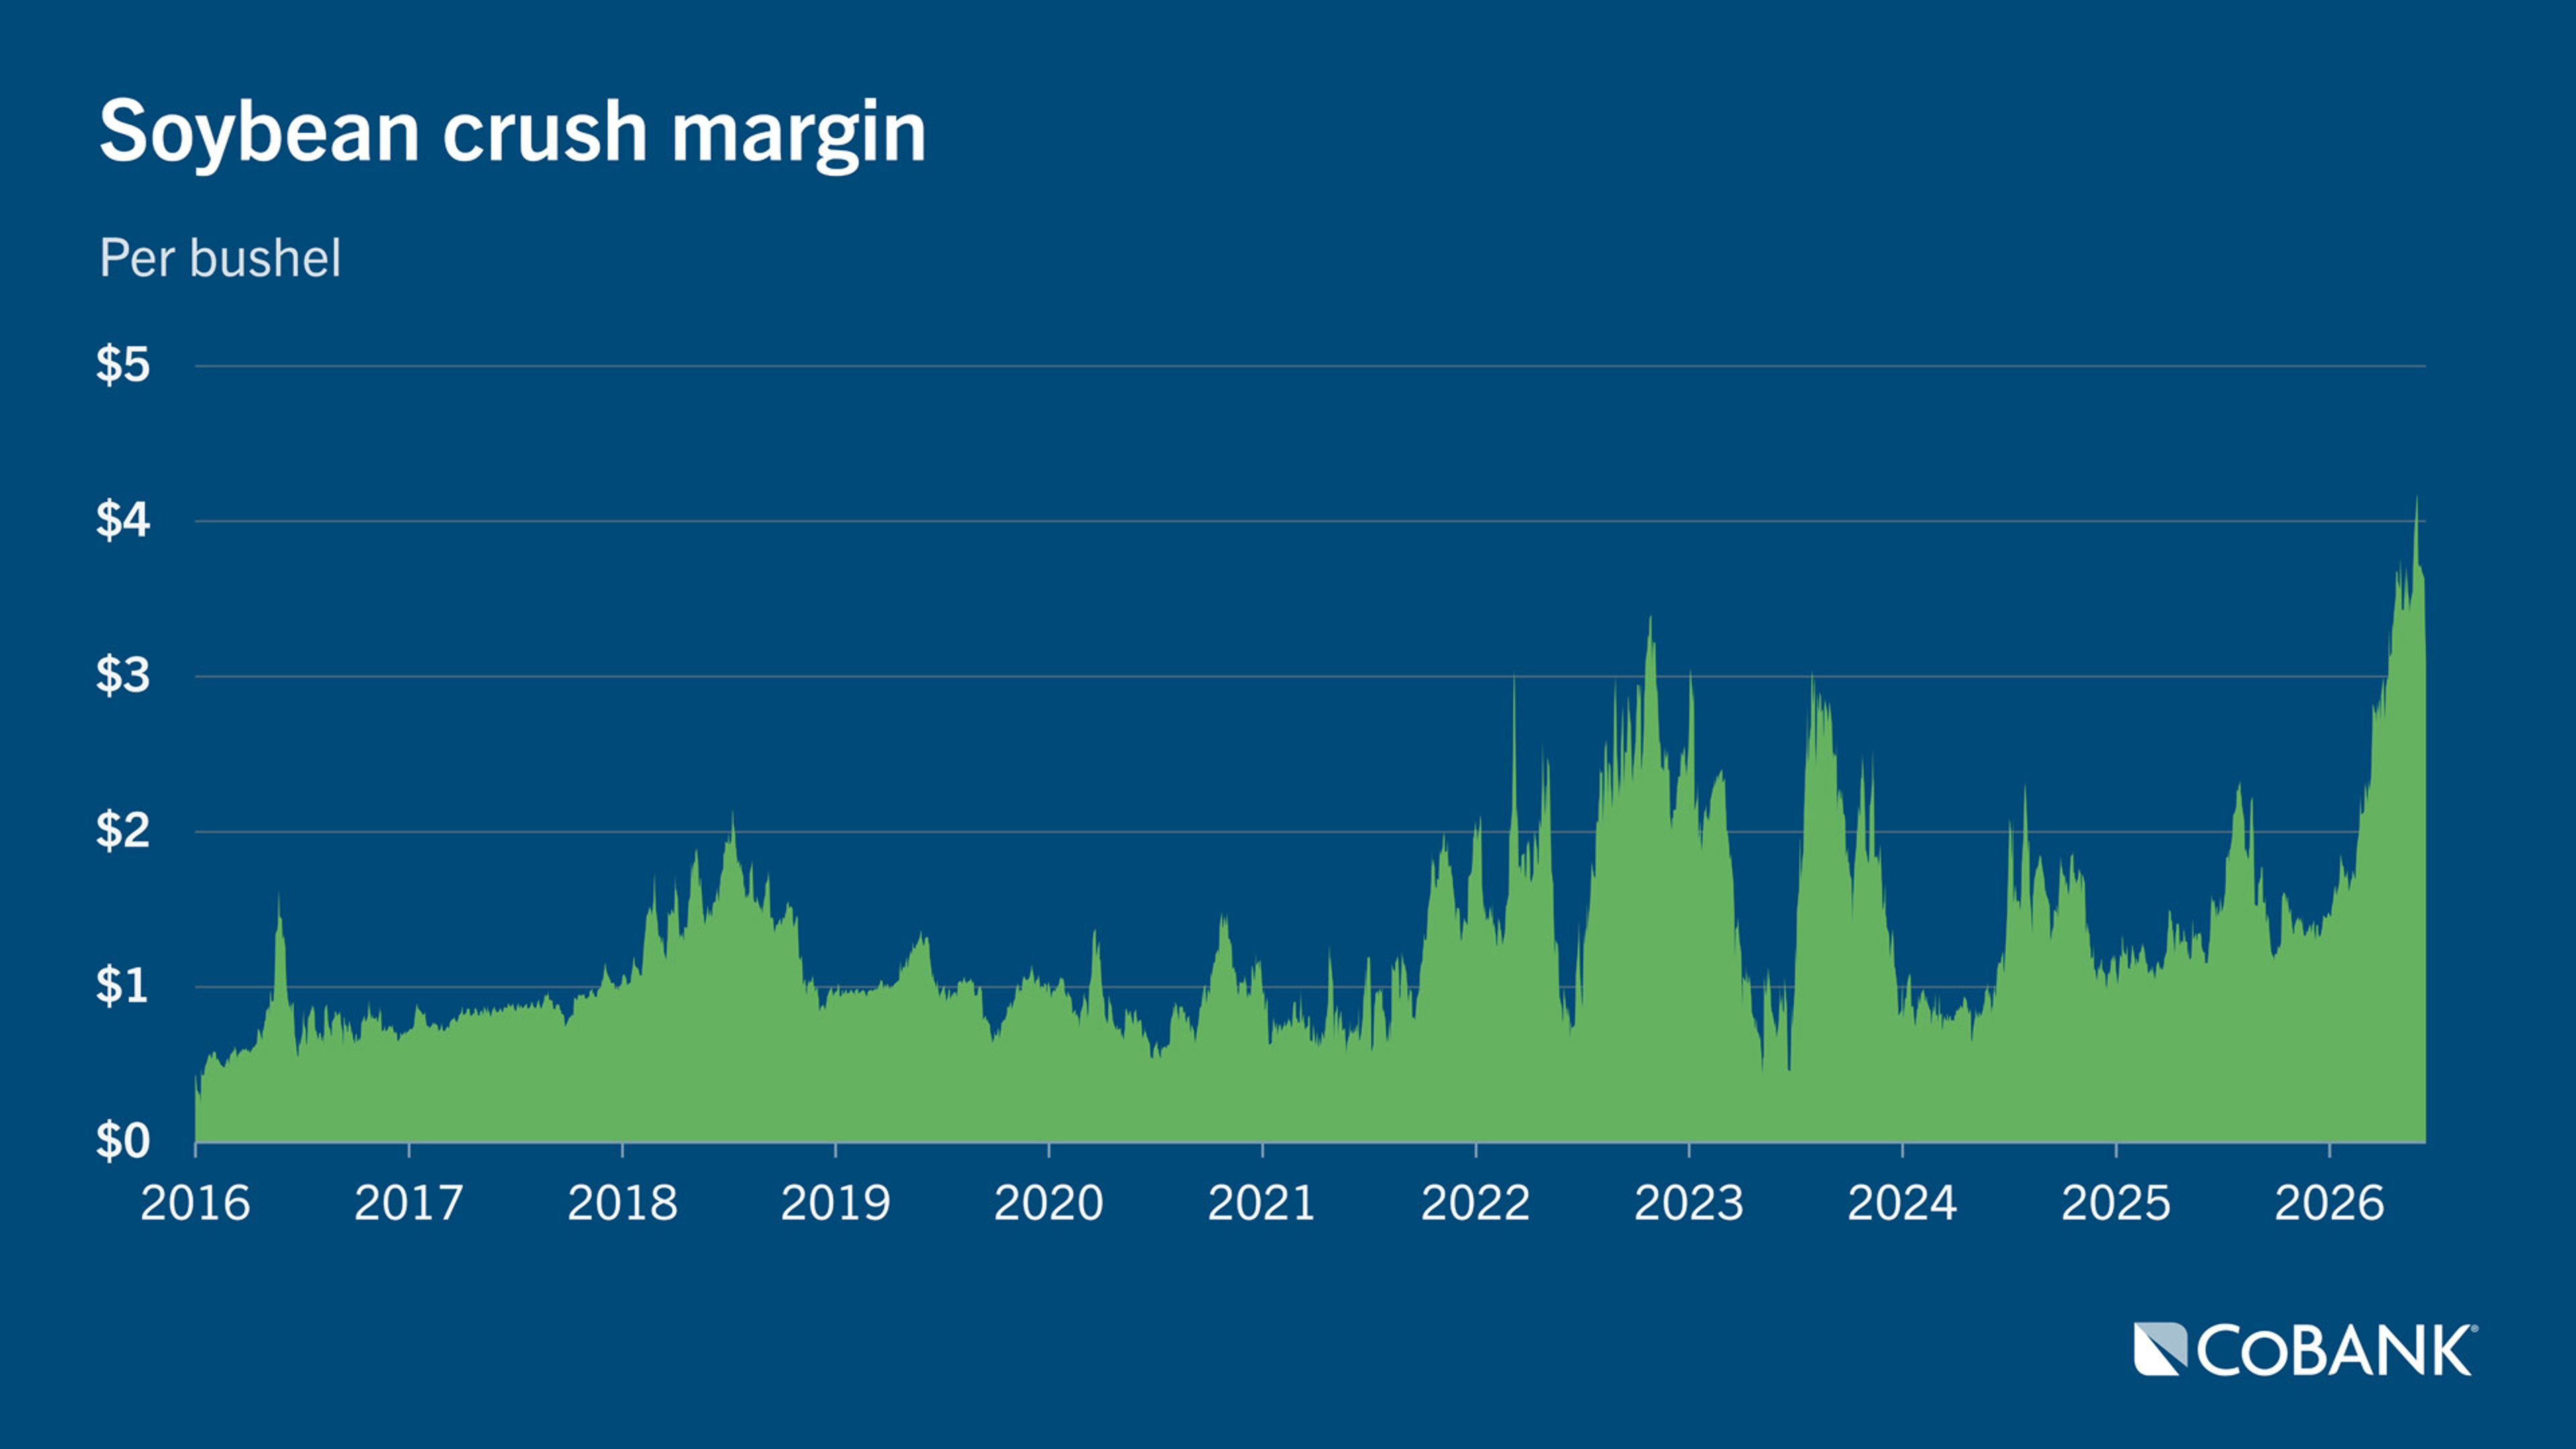
Total soybeans crushed for the marketing year-to-date are up 8.0% YoY with the pace consistently reaching monthly records. High diesel prices following the U.S.-Israeli attack on Iran have given biofuel feedstocks like soybean oil additional price support. Record soymeal exports and growing soymeal feed demand have been a bonus.
Old-crop soybean exports continue to lag in the absence of Chinese demand but reports of new-crop soybean purchases by Chinese state-owned firms are raising hopes of a return to more normal trade. Total U.S. export commitments for the current marketing year are down 19.3% YoY. U.S. soybean stocks on June 1 were up 5.3% YoY on soft export demand.
Soybean prices fell 2.3% through the second quarter on benign growing conditions, a stronger dollar and a retraction in energy markets responding to de-escalation in the Middle East. USDA estimates U.S. planted soybean area at 85.4 million acres, up 5.1% YoY. Emerging heat in the U.S. Midwest is raising concern over soybean yields, but weather in September during flowering will be the most critical period in determining crop productivity.
Wheat
Drought on the Plains dominated the news cycle for wheat last quarter with the U.S. expected to harvest the smallest winter wheat crop since 1965 and with harvested acreage for all wheat figured to be the lowest since 1877. USDA estimates the hard red winter (HRW) wheat crop to be down 38% YoY on sharply lower yields and the highest abandonment rate in decades. Drenching rains during harvest exacerbated quality issues following several freezes during the growing season. Grain elevators and millers plan to blend low-quality new-crop wheat with higher-quality old-crop stocks or spring wheat to achieve milling quality standards.
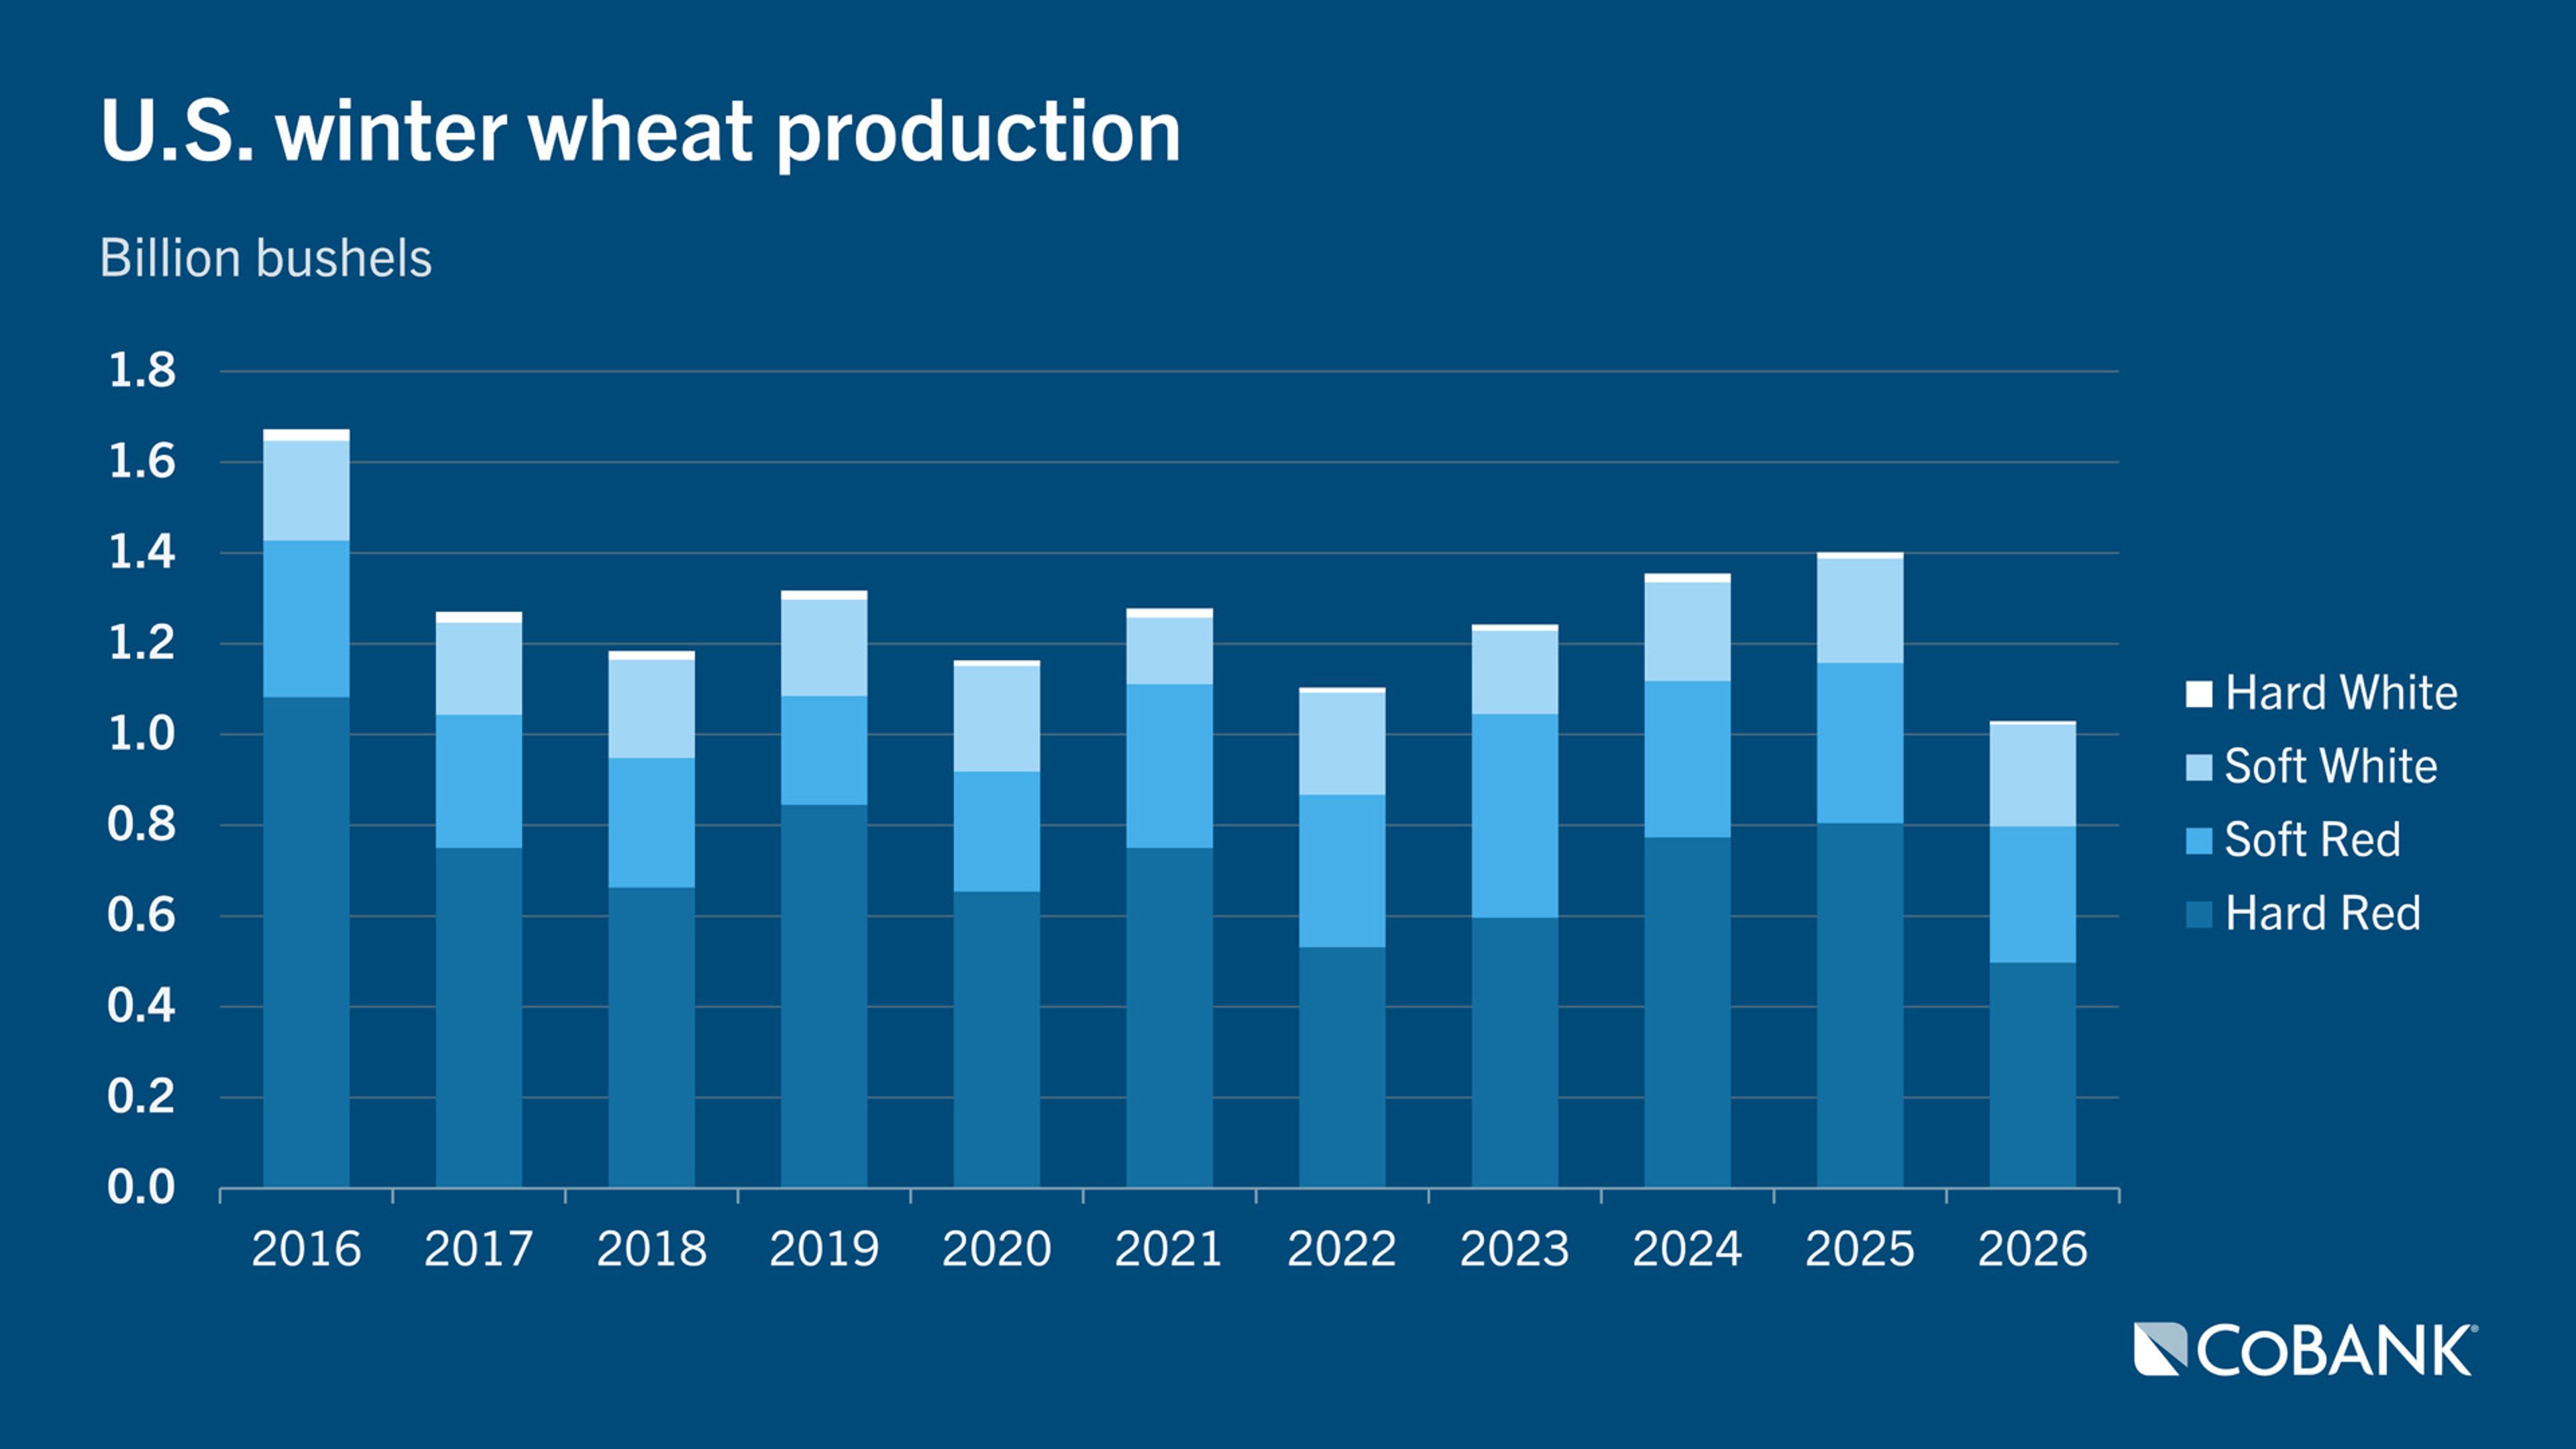
U.S. wheat stocks on June 1 are up 7.6% YoY thanks to last year’s bigger harvest, buffering the smaller winter wheat harvest. Falling spring wheat acreage, though, threatens to further tighten U.S. new-crop supply just as world wheat supply atrophies. USDA estimates U.S. all-wheat planted acreage for 2026/27 at 42.7 million acres, down 5.7% YoY and the lowest planted area since records began in 1919.
Globally, lower yields in Europe from extreme heat, a slightly smaller Russian crop and reduced wheat acreage among major exporters like Canada, Kazakhstan, Australia and Argentina are expected to add further pressure on world wheat supply longer term. Wheat prices rose 1.7% for the quarter as traders weighed the smaller U.S. winter wheat harvest against the current global supply abundance. Attention is now shifting to a view of tightening world wheat balance sheets.
Disclaimer: The information provided in this report is not intended to be investment, tax, or legal advice and should not be relied upon by recipients for such purposes. The information contained in this report has been compiled from what CoBank regards as reliable sources. However, CoBank does not make any representation or warranty regarding the content, and disclaims any responsibility for the information, materials, third-party opinions, and data included in this report. In no event will CoBank be liable for any decision made or actions taken by any person or persons relying on the information contained in this report.